SysOrb Network Monitoring System User's Guide
For version 3.8.0

Copyright © 1999 - 2012 Evalesco A/S
- Table of Contents
- Abstract
- 1. System Overview
-
- 1.1. SysOrb Components
- 1.2. Users, Groups and Paths
- 1.3. Alert concepts
-
- 1.3.1. Alert acknowledgement
- 1.4. Domains
- 2. Getting started
-
- 2.1. First Login and default password
- 2.2. Changing default password
- 2.3. Auto-discovering Nodes
- 2.4. Interpreting SysOrb graphs
-
- 2.4.1. Continuous graphs
- 2.4.2. Enumeration graphs
- 2.4.3. Uptime graphs
- 3. User management
-
- 3.1. Domains
-
- 3.1.1. Adding domains
- 3.1.2. Editing domains
- 3.1.3. Deleting domains
- 3.1.4. Domain representation
- 3.1.5. Quick links
- 3.2. Users
-
- 3.2.1. Adding users
- 3.2.2. Editing users
- 3.2.3. Deleting users
- 3.3. Preferences
- 3.4. Paths
-
- 3.4.1. Adding paths to a user
- 3.4.2. Testing paths
- 3.4.3. Editing paths
- 3.4.4. Deleting paths
- 3.4.5. Using Numerical Pagers
- 3.5. Groups
-
- 3.5.1. Adding groups
- 3.5.2. Editing groups
- 3.5.3. Deleting groups
- 4. Host/Node Management
-
- 4.1. Monitoring a New Node
- 4.2. Reconfiguring a Node
- 4.3. Deleting a Node
- 4.4. Setting Up Checks
-
- 4.4.1. NetChecks
- 4.4.2. AgentChecks
- 4.4.3. snmpChecks
- 4.4.4. Cumulative checks
- 4.5. Dependencies
-
- 4.5.1. Implicit dependencies
- 4.5.2. Explicit dependencies
- 4.5.3. Simple dependency setup
- 4.5.4. NodeClass dependencies
- 4.6. NodeClasses
-
- 4.6.1. Sub-classes (inheritance)
- 4.6.2. Associating NodeClasses to a Node
- 4.6.3. Creating / Editing NodeClasses
- 4.6.4. Check templates
- 4.6.5. Detection rules
- 4.6.6. Distributing standard NodeClasses
- 4.7. NodeViews
- 4.8. MultiCheck graphs
- 4.9. Moving Nodes between Domains
- 5. Auto-discovering nodes on network
- 6. Report generation
-
- 6.1. Creating a report template
-
- 6.1.1. Step 1: report type
- 6.1.2. Step 2: Node selection
- 6.1.3. Step 3: NodeClass selection
- 6.1.4. Step 4: Check selection
- 6.1.5. Finalization
- 6.2. Generating the report from the template
- 6.3. Reading the generated reports
- 7. Views
-
- 7.1. Adding a new view
- 7.2. Edit a view
- 7.3. Reconfiguring layout of a view.
- 7.4. Use a view
- 7.5. Views and domains
- 8. External tools
- 9. Forecasts
- 10. Special purpose Web-interface features
- List of Examples
- 10-1. Link to a status page
- 10-2. Link to a status page with automatic login
Abstract
This document describes how to use the SysOrb Network Monitoring System once the server and agent programs are set up successfully. If you have not yet a running SysOrb Server, please consult the administrators guide first. You will need some of this information in order to configure the SysOrb Agent fully. This document addresses the 3.8.0 release of SysOrb. For further information please visit http://www.evalesco.com.
Chapter 1. System Overview
The purpose of the SysOrb Network Monitoring System is to monitor servers, applications and devices in a network by talking to the servers and retrieving information about running services, current load, etc. This information can be used by the administrators of the network to track down problems with their servers, document resource utilization, etc.
1.1. SysOrb Components
The SysOrb Network Monitoring System consists of several major software components, the responsibilities of which are outlined below:
-
The SysOrb Server: This is the center of the SysOrb System. The Server can remotely check networked services (such as web servers and mail servers) via NetChecks, but it is also the central component to which the Agents will report device information and statistics. The SysOrb Server is the central repository in which all statistical and operational data are stored, and it is the entity in the SysOrb System that will actively alert administrators when problems arise in any of the monitored systems.
In the following text a node is any machine or device that can be monitored by SysOrb. A host is a node where the SysOrb Agent can be installed.
-
The SysOrb Agent: In order to actively monitor local devices (such as harddrives, memory, processor statistics etc.) on networked systems, those systems must run the SysOrb Agent. This program will gather operational information from the system on which it is running, and report these data to the SysOrb Server for further processing. In case of failures (such as a harddisk running full, or a crashed service process), the SysOrb Server can actively alert the administrators of the particular machine that reported the failure.
-
The Web Interface: In order to allow easy access to the monitoring data and then configuration of the SysOrb System from anywhere and from any platform, the Web-based Interface is provided. This User Interface ships as a part of the SysOrb Server, and is usually (but not necessarily) run on the same physical machine as the one running the SysOrb Server. In order to fully use and configure monitored services or devices in the SysOrb System, all you need is a computer with a web-browser capable of accessing the SysOrb Server computer.
1.2. Users, Groups and Paths
The SysOrb System has a concept of Users, Groups and Paths, to allow for different groups of people to be alerted in case of alerts raised on monitored node.
A User is a person with access to the SysOrb Network Monitoring System. This person has a username and a password. By means of the username and password, the person can access status information on the SysOrb Network Monitoring System.
A User can have a number of Paths. A Path describes a way the SysOrb Network Monitoring System can notify the user of a warning or an alert. A path can be the phone number of a numerical pager, an e-mail address of a mailbox or the phone number of a cellular phone belonging to that user.
A Group is the logical entity that is notified when an alert is raised. A Group can refer to zero or more Paths. This basically means that if machine mail.sysorb.com causes an Alert in the SysOrb Network Monitoring System, this can cause one Group to be notified. This Group could then refer to the Paths of a few administrators responsible for that node.
While this system might seem a little complex at first glance, it does give the user a powerful way of notifying the right people. When complex networks and systems are being monitored the use of paths is a great help as it allows SysOrb to notify users in different ways depending on what warnings and alerts have been raised.
1.3. Alert concepts
In SysOrb there are two alert strategies. The most simple one is the immediate strategy. When a node or a check is configured to use the immediate strategy, SysOrb will send out an alert the first time the check or node fails. This is especially useful for checks such as uptime, process presence, RAID status and other checks which have no natural fluctuation (that is, just one bad reading means that something is really wrong).
The other alert strategy is ScoreKeeper. ScoreKeeper is useful when SysOrb is monitoring something that sporadically peaks above the set limits. For example, if the network response time to some remote node is monitored, and the maximal delay is configured to be 10 ms, we do not usually want an alert if the delay sporadically exceeds this limit. It may be just one single packet that was delayed, so even though it may be way above the acceptable delay limit, it is still acceptable because it was a one-time incident.
In order to work with this kind of fuzzy limits, a score is kept for each node and each of it's checks.
The ideal score is 0. A score can never go below 0. If a check results in a warning, the score will be incremented with some specified value, until the Warn Ceiling is hit. If a check results in an alert, the score is increased further until the Alert Ceiling is hit. The score can never exceed the Alert Ceiling. If the check succeeds, the score will be decremented with some value, until it reaches 0 again.
All the scores are updated every five seconds. The scores are updated based on the last known value from each check.
When you choose to configure a new node in the SysOrb Network Monitoring System, you will be given the choice of specifying the mentioned limits and increment / decrement values. The node's limits are used as limits for all the checks on the node. The increment / decrement values contrarily, are defined for each check on the node. This is because they are used to increment / decrement the score on the associated check only. All the check scores are checked against the node's limits. If the limits are exceeded an alert can be issued. The default values are perfectly appropriate for most uses, so you need not try to understand the deeper relationship between the values and the way warnings and alerts will work. If you do, however, decide to change these values, you have to be certain of the consequences of the changes as a mis-configured system is a lot worse than a system running with a sub-optimal configuration.
We recommend that you leave the score and warning / alert / ceiling values to their defaults, and only change them if you both understand what the change will mean, and actually have a need to change them.
1.3.1. Alert acknowledgement
Sometimes a check may enter alert state and leave again so quickly, that you may risk nobody notices. Of course, if SysOrb is configured to send out email alerts, it will send one no matter how brief the alert state was. But the email can get lost, or the user may have requested not to receive more that one SysOrb mail every half hour, and if he has got one recently, he may never receive an email for this particular alert.
To be absolutely sure, that no alerts go unnoticed, SysOrb allows an option called Alert Acknowledgement to be enabled per check. When that is enabled, the check will stay in alert state, even if the original cause of the problem goes away.
This could be useful on a process presence check for instance, if the operating system restarts a given process after a short period of time, but you still want to notice, if it has been missing. In that case enabling Alert Acknowledgement will result in a red icon showing up as soon as the process stops, and staying red even when the process starts again. After the process has started you must explicitly acknowledge the alert through the web interface for the icon to revert to green.
Some checks (currently only LogChecks) makes no sense without alert acknowledgement enabled. That is so because a bad log line appearing in the log, is treated by SysOrb as an instantaneous alert state, returning immediately to good state awaiting the next line to be appended to the log. With alert acknowledgement enabled it will of course stay in alert state until a user explicitly acknowledges.
1.4. Domains
An important feature in the SysOrb Network Monitoring System is the use of domains. Domains are a logical way of distinguishing between separate parts of your network. You can monitor nodes on completely different networks, or for different customers or departments, from the same SysOrb Server without confusing the various nodes.
Domains in SysOrb are not only used to sort the monitored nodes, they also allow you to classify SysOrb users. The domains you create will exists in a top-down hierarchy which only allows your users to look down through the tree, not up. In that way you can define a number of domains which will be unaware of each other.
An example of how a set of domains could be configured is:
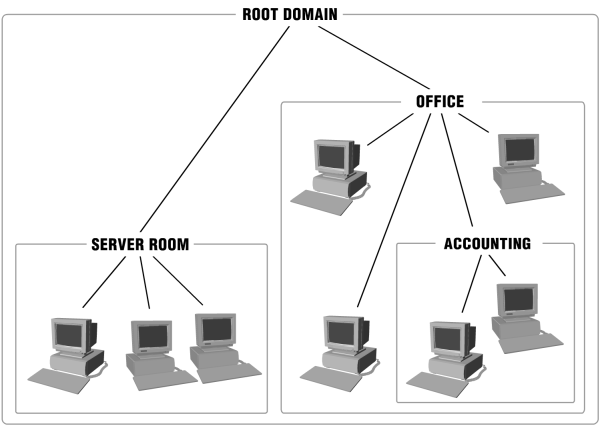
You, the administrator of the Root Domain, would be able to see all three domains and your administrative privileges from the Root Domain is the same in Server room, Office and Accounting domains. Users and administrators defined specifically in the Server room domain will not be able to see the Office or the Accounting domains. Likewise, users in Accounting will not be able to see the Office and Server Room domains. Since the Accounting domain is created as a subdomain to the Office domain all users from Office will be able to see their own domain and Accounting.
Apart from managing users and nodes, domains also handle licensing and as such can be used to limit how many SysOrb Agents the SysOrb Server will allow in a given domain. This comes in useful when administrators of subdomains are free to add SysOrb Agents without consulting the administrator of the Root Domain.
This function is typically used by service providers, as it allows the provider complete control over the amount of licenses each customer can use. This allows the customer full control over the monitoring of his/her servers, without allowing him/her to use up all the service providers licenses.
Chapter 2. Getting started
When you have a SysOrb Server and Web-Interface installed,
configured, and running (as described in The
Administrator's Guide), you should be ready to log on for the
first time. By now you should be able to get the SysOrb Login
Screen in your browser. If you do not have this login screen,
please consult the Administrator's guide again, or ask <support@evalesco.com>
for help. From here on we assume that you have a working Web
Interface and Server installation.
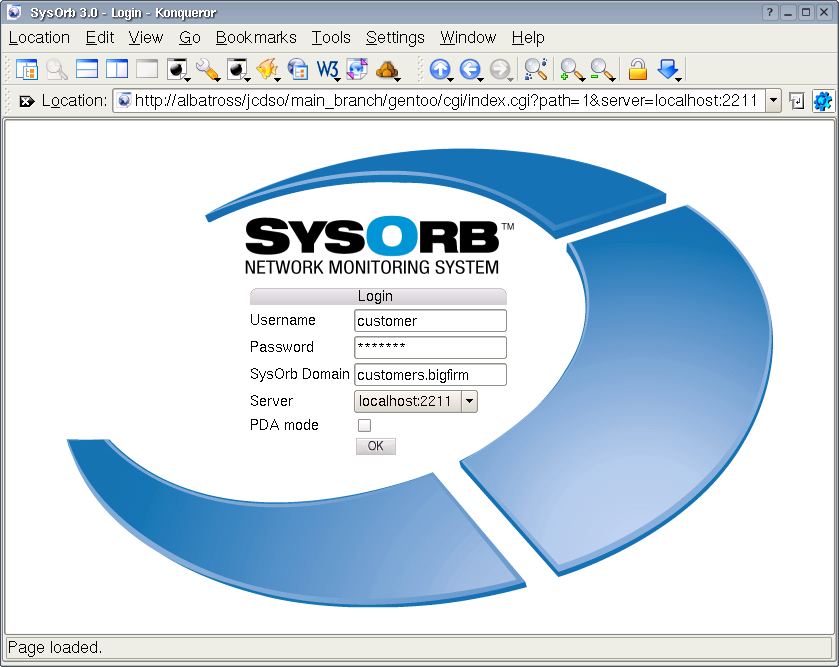
2.1. First Login and default password
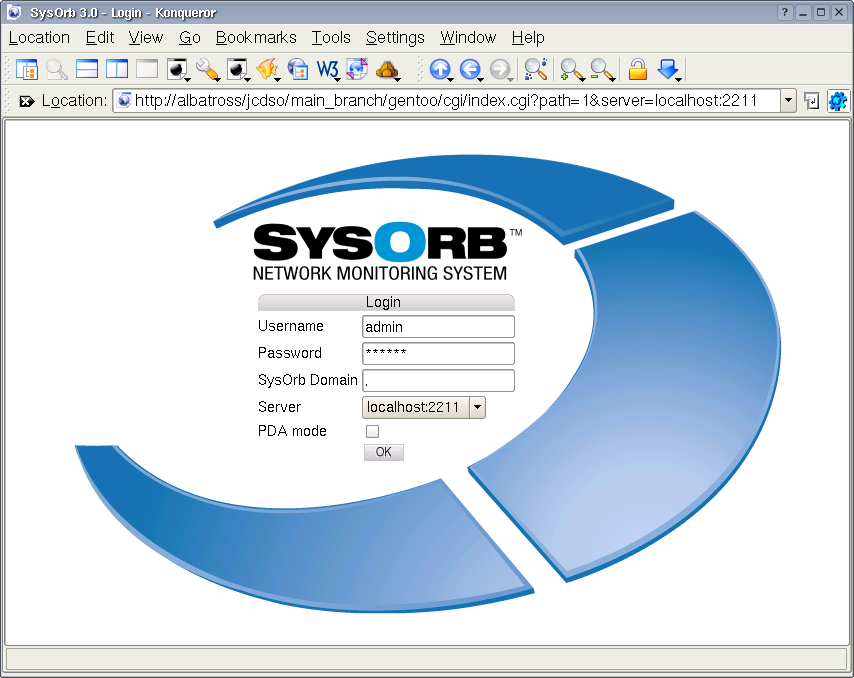
The SysOrb login screen.
The default configuration of the SysOrb Server creates one account. You can use the username and password given below to login to the SysOrb Web Interface running on your SysOrb Server:
-
Username: admin
-
Password: admtest
-
Domain: (nothing - leave blank)
You should now see the Overview page, with two domains (Root domain and SysOrb Server). The domain SysOrb Server contains a node representing the SysOrb Server itself, but is currently of little interest.
2.2. Changing default password
The admin account has a standard password which you should change for security reasons. To do this log in with the username, password and domain given above and go to the section by using the navigation buttons at left side of the page. This will give you a list of the things configured in your SysOrb system.
Select the option for the user admin and you will get a list of options that can be edited for that user. Enter your new administrator password in the fields Password and Password again and press the button at the bottom of the page. The password has now been changed.
2.3. Auto-discovering Nodes
To quickly setup monitoring for nodes on the network, you can use the auto-discovery feature of SysOrb. This is explained in Chapter 5.
2.4. Interpreting SysOrb graphs
Once the first checks have been set up and data are flowing into SysOrb, you can click on the status line for a check to see the historical data stored for that check.
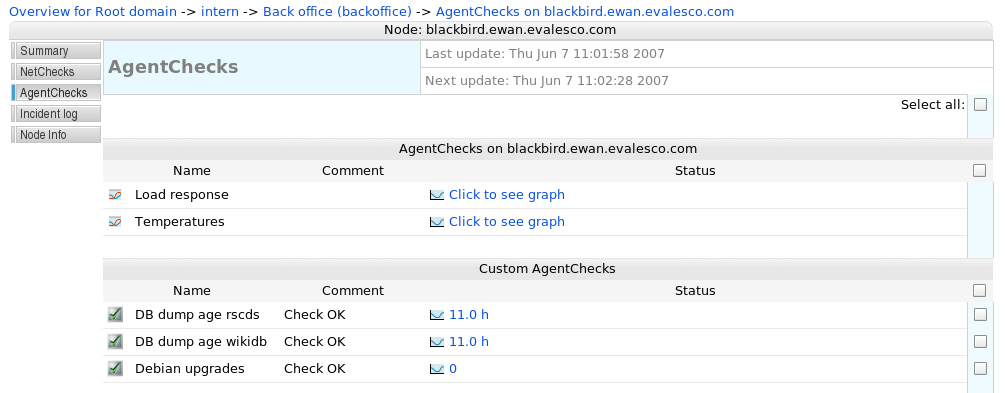
A list of agent checks on a node - clicking on the status links will display the graphs of actual historical data
There are several types of graphs in SysOrb, because there are several types of data that can be monitored: Continuous data such as temperatures, disk space, response times etc. are displayed as curves in a coordinate system. Enumeration data such as RAID disk status, switch port status, process presence etc. are displayed on a special "time line" with colored areas depicting both the actual readout value of the check ("degraded", "missing" for RAID for example) and the status of that value ("warning", "alert" for example). Uptime graphs provide a flexible display of how long a system has been up, and when it has rebooted.
2.4.1. Continuous graphs
Continuous graphs hold a lot of information. In its most simple form, the graph will show the evolution of a single check result over time. At the top of the graph, a line shows "Min", "Avg" and "Max" numbers; these are the minimum, average and maximum numbers recorded in the period shown. Please note, that the deep-blue curve drawn represents averages over short intervals, and therefore the top and the bottom of the curve may not correspond to the "Min" and "Max" numbers printed at the top of the graph. In order to actually see the real minimum and maximum values too, one can click the "Show min/max" checkbox at the very left of the web interface (not shown in the images here).
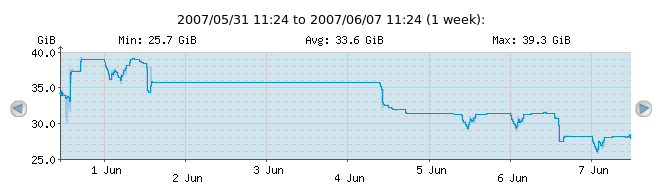
A very simple check; free space on a filesystem, as it has evolved over time
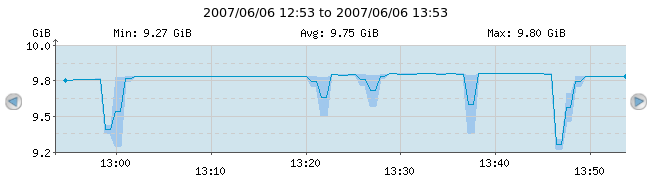
Notice the blue shade around the deep-blue curve around the times when the curve changes a lot
Warning and alert thresholds are also shown on the continuous graphs. In the following example, the check has "Warn when above" set to 400ms and "Alert when above" set to 800ms.
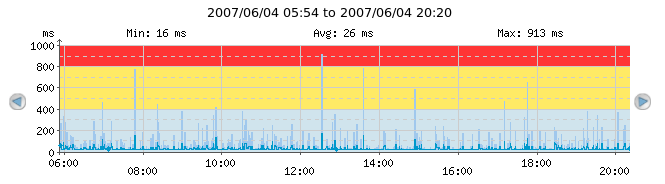
The red shaded area symbolizes the area in which the check would be in alert state with the current thresholds. The yellow shaded area symbolizes the area in which the check would be in warning state with the current thresholds
Packet loss on for example ICMP Ping checks (or other loss of data, depending on the check type) can be shown in the continuous graphs, if the "No response %" checkbox is clicked.
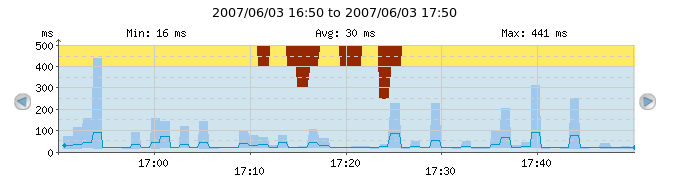
The dark-red shades from the top of the graph symbolize packet loss. On most of the graph, the packet loss is 0% because there is no dark-red shade; but from 17:10 till around 17:25 we see from zero to 50% packet loss
2.4.2. Enumeration graphs
Enumeration graphs depict the state of a check over time. The following graph shows the results of a SAF-TE SCSI enclosure disk check. There are two colored areas in the enumeration graph; the tallest top area displays the check result ("No error", "Rebuilding", "Predicted fault", etc.) while the shorter bottom area is either green, yellow or red and displays the SysOrb alert status ("ok", "warning", "alert").
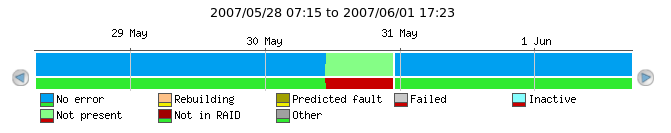
Most of the time, this disk has had "No error" which resulted in an "ok" status (green). From around mid-day on May 30th till almost midnight, the disk was "Not present" which resulted in "alert" status (red).
2.4.3. Uptime graphs
Uptime graphs provide a quick overview of how long a given system has been up and running, when it last rebooted, and how frequently it is rebooting.
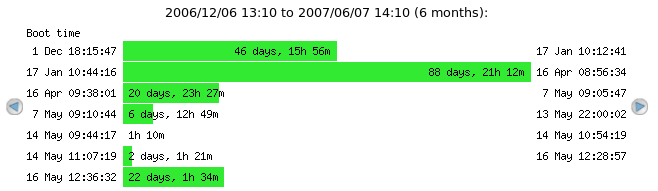
From the bottom-most bar, we can see that this particular system was last booted on May 16th around 12:36 and has been running for a little more than 22 days so far
Chapter 3. User management
As mentioned in Chapter 1 the SysOrb Network Monitoring System relies on domains, groups and paths to notify the right persons about warnings and alerts. Whenever an alert is caused by a machine in a domain, a group will be alerted and messages will be sent to every one of that group's paths.
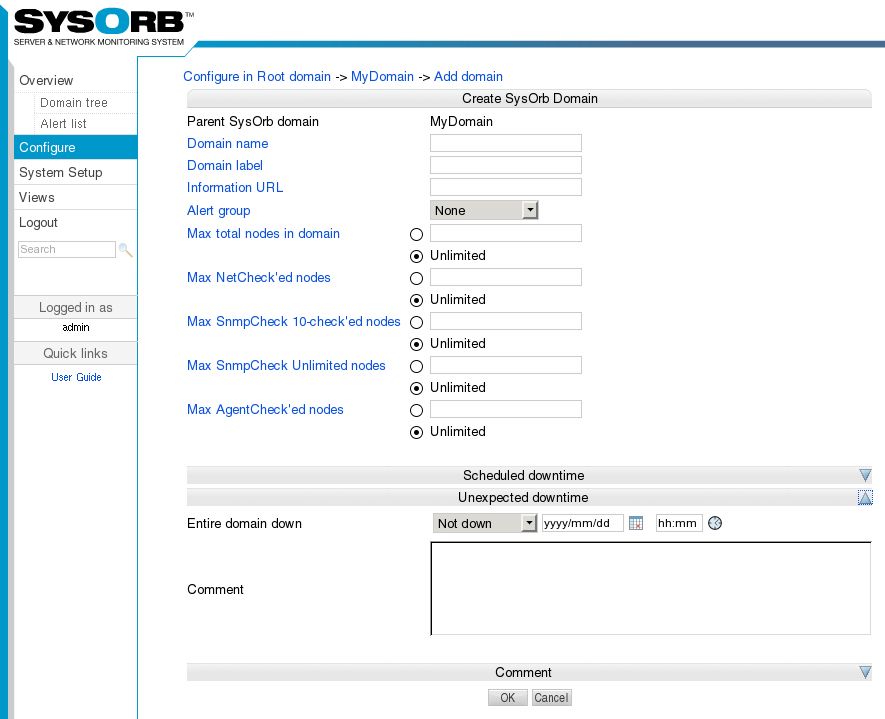
3.1. Domains
To properly manage the use of domains in SysOrb you need to know or decide a few things about the part of your network you wish to configure as a domain.
Most of the following options concern the maximum allowed number of various things in the domain. This is only relevant if multiple administrators work in different domains, and the super-administrator wants to impose limits on the number of resources each of the lesser administrators should dispose of. Every limit should be interpreted as a bound on the number of nodes in this domain and all of its subdomains, the subdomains may themselves have limits, but still the constraints on the outer domain will be enforced. The limits on the outermost domain is ultimately determined by the license, and of course cannot be set by any administrator.
-
Domain name: this is the name by which you will know the domain. We recommend using human-understandable names like "Development", "Marketing" or well defined abbreviations. Please note that domain names are no longer case sensitive.
-
Domain label: in addition to the name of the domain you can have a label that will be shown in the overview along with the name.
-
Alert group: a group that should be alerted if when something is in a bad state on this domain. E.g. in order to send an email to a specified address when something goes wrong.
Possible values: None, As domain, AlertGroupX, AlertGroupY,...
Default value: None
-
Information URL: if you have additional documentation regarding this domain for the operators, you can supply an URL here, and SysOrb will show a link to the documentation on the various listings where this domain appears.
-
Max total nodes in domain: this is the maximum number of nodes allowed in the domain. Both SysOrb Agents and nodes with only NetChecks count toward this number.
If set to Unlimited any number of nodes can be created in this domain.
-
Max NetCheck'ed nodes: this is the maximum number of nodes in the domain, that can be monitored using NetChecks. Note, however, that an AgentCheck'ed host can also be monitored using NetChecks without counting towards this limit.
If set to Unlimited any number of nodes may be NetChecked, while observing the above limit on the total number of nodes, as well as any limits on outer domains.
-
Max SnmpCheck 10 nodes: this is the maximum number of nodes in the domain, that can be monitored using up to 10 SnmpChecks. Note, however, that an AgentCheck'ed host can also be monitored using SnmpChecks without counting towards this limit.
If set to Unlimited any number of nodes may be SnmpChecked with up to 10 checks, while observing the limit on the total number of nodes, as well as any limits on outer domains.
-
Max SnmpCheck Unlimited nodes: this is the maximum number of nodes in the domain, that can be monitored using an unlimited number of SnmpChecks. Note, however, that an AgentCheck'ed host can also be monitored using SnmpChecks without counting towards this limit.
If set to Unlimited any number of nodes may be SnmpChecked, while observing the limit on the total number of nodes, as well as any limits on outer domains.
-
Max AgentCheck'ed nodes: this is the maximum number of SysOrb Agents that are allowed to check in to the new domain on the SysOrb Server. This option is useful for controlling how many SysOrb Agent licenses a given domain can use.
If set to Unlimited any number of hosts can check-in to this domain, while observing the limit on the total number of nodes, as well as any limits on outer domains. This also means that it would be possible for an administrator of this domain to use up all the AgentCheck licenses.
-
Scheduled downtime: Some node are only used in certain periods, for instance during working hours. SysOrb can be instructed only to send warnings and alerts during these periods. It will still perform the checks around the clock for statistical purposes, just not send warnings or alerts outside working hours. Setting the scheduled downtime of a domain, will pass the scheduled downtime on to any machines (or subdomains) in the domain. So this is an easy way to have downtime configured the same way for many nodes..
You configure this by specifying all the time intervals of the week, for which SysOrb should not send warnings or alerts. For instance if you want SysOrb to monitor the domain from 8 am to 4 pm every workday, you would add downtime intervals from 0:00:00 to 8:00:00 and from 16:00:00 to 23:59:60 on each of Monday to Friday, and one interval from 0:00:00 to 23:59:60 on Saturday and Sunday.
-
Unexpected downtime: When SysOrb detects a problem with many machines in a domain (e.g. due to a router failure), you sometimes know that someone will deal with it at some specific later time. You do not want to be flooded with SysOrb messages until then. In that case you can use these fields to instruct SysOrb not to send any warnings or alerts regarding all nodes in this domain until some later point in time.
Using the drop-down box labeled Domain down you can select that all the nodes in the domain will be down for 1, 3, 6 or 24 hours. You can also select the option named "Until", and enter a date and time in the text field to the right.
When enabling unexpected downtime you can choose to let SysOrb send a notification to anyone ordinarily receiving warnings or alerts regarding this node. This is accomplished using the Notify group drop-down box.
3.1.1. Adding domains
To add a new domain, do the following:
-
Select from the navigation buttons at the left.
-
Click you way through the domain tree until you have selected the domain under which you wish to create a new domain
-
Press the button.
-
Fill out the information about the domain as described above.
-
Press the button to accept the new domain or the button to cancel.
3.1.2. Editing domains
To change the options for a domain, do the following:
-
Select from the navigation buttons at the left.
-
Click you way through the domain tree until you have selected the domain where the domain you wish to edit is located.
-
Select the option for the domain you wish to edit.
-
Change the options for the domain.
-
Press the button to accept the changes or the button to discard the changes.
3.1.3. Deleting domains
To delete a domain, do the following:
-
Select from the navigation buttons at the left.
-
Click you way through the domain tree until you have selected the domain where the domain you wish to delete is located.
-
Click the link to the right of the domain.
-
You will be asked to confirm the deletion of the domain. Press the button to delete the domain or to keep the domain.
3.1.4. Domain representation
When you are just using the Web-interface, you normally won't need to know how to represent a path to a domain in text. This is however nessesary when you configure the SysOrb Agent, or when you wish to log in to a subdomain. The root domain is represented as a dot ("."). A subdomain to the root domain, is represented by it's name alone (eg. "world"). Subdomains to this domain is represented by all the names from the parent domain, separated by dots with the outermost domains to the left (eg. "world.continents.europe").
3.1.5. Quick links
Quick links makes it possible to add links to the navigation bar on the left in the web interface. The URL's associated with the links can contain special variables that will get substituted with appropriate values. E.g. the link http://www.helpdesk.com/index.cgi?node=$node$ will have the $node$ part substituted with the id of the current node.
Quick links are associated to a domain. Every user of this domain can see these links. Users in subdomains can only see the links if the links have been marked Visible in subdomains.
A Quick link has the following properties:
-
Quick link name: This is the name that will be shown in left bar in the web interface.
-
URL: This is the URL that the link should point at. The URL can contain variables that will get substituted as decribed above. There are several variables is defined, but the most useful ones are: $domain$, $user$, $node$ and $version$.
-
Visible in subdomains: This checkbox indicates whether the link is visible for users in subdomains of this domain.
For Adding, editing and deleting a quicklink use the following steps:
-
Select from the navigation buttons at the left.
-
Click you way through the domain tree until you have selected the domain where the domain you wish to add links to is located.
-
Select the option for the domain you wish to edit.
-
Select the button to list the currently available quick links.
-
Select the button to get to the link creation page. Select next to a existing link in order to edit it. Select next to a existing link in order to delete it.
-
When adding or editing a quick link. Fill the properties as described above and click .
3.2. Users
Each user is, when created, assigned to a specific domain and the user and his or her user rights will be inherited down to any subdomain.
The information stored about a user, can be categorized into three groups. It is either basic information about the user (e.g. name and rights), paths, or preferences.
The basic properties for a user are:
-
Login name: The name the user must use to log in to the system.
-
Real name: The users real name. Only used as a help for the administrator.
-
Password: The password the user must use to log in to the system.
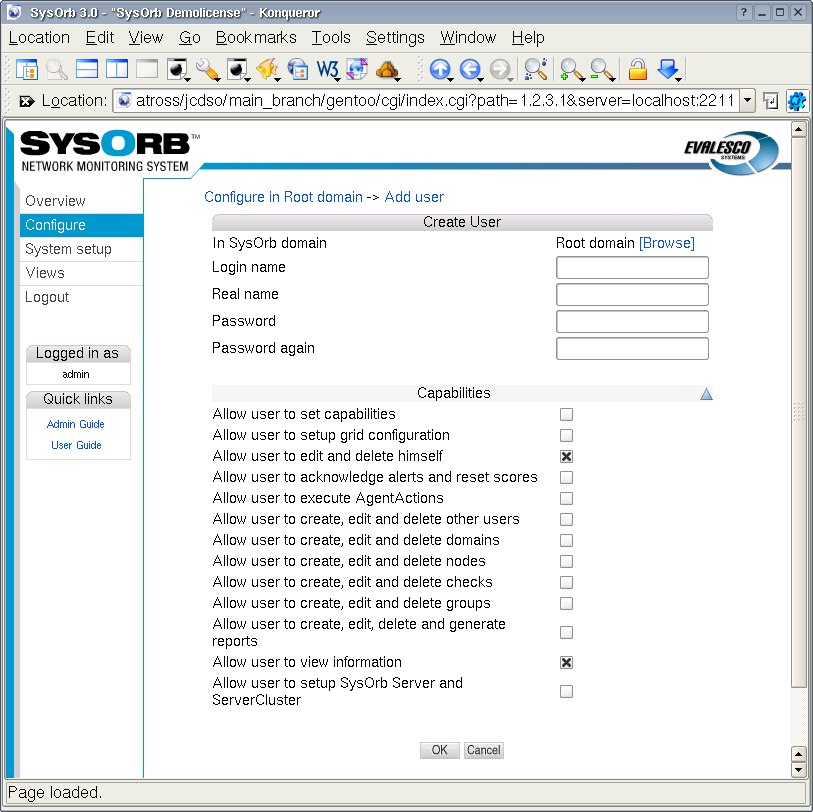
Apart from these basic properties, the user has as set of capabilities, which determine which actions the user are allowed to undertake within SysOrb.
-
View information: This capability allows the user to view the results of the performed checks, all public generated reports, and public views.
Default value: On
Note: If this capability isn't selected, the user will not be able to login to the user interface.
-
Edit and delete oneself: Allows the user to edit his or her own information, including his or her password, and to delete the user account. This does not allow the user to edit his own capabilities.
It also gives the user the right to add and edit his own views and alert paths.
Default value: On
-
Downtime, acknowledge and reset scores: Enabling this allows the the user to set downtime, acknowledge alerts and reset scores on both nodes and checks, but not otherwise change any node or check settings.
Default value: Off
-
Execute AgentActions: This capability allows the user to start an AgentAction on a node.
Default value: Off
-
Create, edit and delete other users: Lets the user administer other user accounts, changing their password, name etc.
A user with this capability can also create new users, but without the "Set capabilities" capability, the created users will only have the rights to "View information", and to "Edit and delete oneself".
Furthermore, this capability together with the capability to "Edit and delete oneself", will allow the user to edit and view other users Views (as the user could simply delete the other user, and take ownership of his views anyway). Without the capability to "Edit and delete oneself", other users private views can be seen, but not edited.
In combination with the capbaility to "Create, edit, delete and generate reports", this capability allows the user to view and edit the private reports of other users.
However, the user is only allowed to edit a private view or report, if the owner of the view or report is from the same domain or a subdomain of the users domain. This means that e.g. if a user from the Root domain creates a private report in the Customer.A domain, then a user with all capabilities enabled, will not be able to edit this report. This can only happen if the view or report has "Public edit" enabled.
Default value: Off
-
Create, edit and delete domains: Allows the user to edit or add new subdomains to his or her Origin Domain. It also allows the user to create or edit QuickLinks and Report headers/footers in his Origin Domain and all subdomains to this.
If the user is located in the root domain, it also allows him/her to import MIB-files into the SysOrb Server.
Default value: Off
-
Create, edit and delete nodes: Lets the user configure nodes in his or her Origin Domain and all the subdomains. It also allows the user to edit and configure NodeClasses created in the Origin domain or one of its subdomains.
This option also allows the user to acknowledge alerts, reset scores, and configure downtime, but only for nodes.
Default value: Off
-
Create, edit and delete checks: Allows the user to configure what checks should run on the different nodes in the accessible domains. The user is also allowed to create and edit NodeViews on all accessible nodes.
Lastly, it allows the user to acknowledge alerts, reset scores and configure downtime for checks.
Default value: Off
-
Create, edit and delete groups: Lets the user administer groups and assign alert paths to these in the accessible domains.
Default value: Off
-
Create, edit, delete and generate reports: Lets the user create templates for reports and generate reports from them.
Without this option, the user is not allowed to generate or edit reports, even if they have "Public Editable" set.
Default value: Off
-
Set capabilities (superuser): Lets the user change anything in the domain and its subdomains. This is effectively a way of giving the user full administrative rights in a domain.
Default value: Off
Note: No amount of capabilities can allow a user to access higher level domains. It is therefore perfectly safe to give customers logins with administrative privileges in their own domain.
Security warning: Enabling this capability for a user in the root domain will allow that user to give himself Server setup capability, which will allow him to run arbitrary shell commands on the SysOrb server.
-
Setup grid configuration (superuser): Allows the user to create stations, links, mount points and exports.
Note: This capability only affects users in the root domain
-
Setup SysOrb Server (superuser): This capability only affects SysOrb users in the root domain. When this is enabled the user will be able to setup some server-wide parameters of the SysOrb server, currently only which Custom AlertPaths will be available, and what command to execute.
Default value: Off
Security warning: Enabling this capability effectively allows the user to execute abitrary shell commands on the SysOrb server (through Custom AlertPaths).
When adding new users to a domain you especially need to be careful with the Allow user to set capabilities user right as this will allow the user to change anything in the domain and its subdomains. The Allow user to view information can in most cases be left at its default setting of On as this user right is what allows the user to actually read the information stored by the SysOrb Network Monitoring System.
3.2.1. Adding users
To add a new user to the SysOrb system, do the following:
-
Select from the navigation buttons at the left.
-
Go to the domain in which you wish to create a new user.
-
Press the button.
-
Specify a Username, Real Name, Password and Password again for the user.
-
Assign user rights, see description above.
-
Press the button to add the new user or the button to cancel.
3.2.2. Editing users
To edit a user, do the following:
-
Select from the navigation buttons at the left.
-
Select the domain where the user you wish to edit is located
-
Select the option for the user.
-
Select either or .
-
Perform the needed changes.
-
Press the button to accept the changes or the button to discard the changes.
3.2.3. Deleting users
To delete a user, do the following:
-
Select from the navigation buttons at the left.
-
Select the domain where the user you wish to delete is located
-
Click on the link places to the right of the user you wish to delete.
-
You will be asked to confirm the deletion of the user. Press the button to delete the user and to keep the user.
3.3. Preferences
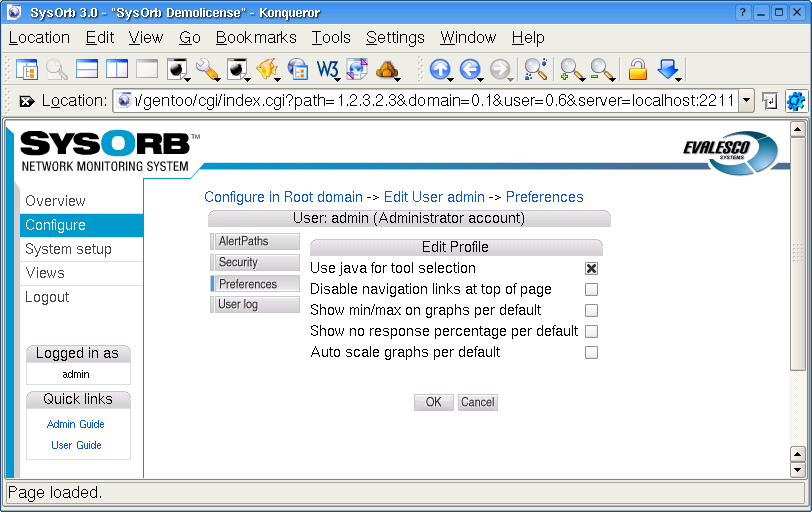
Each user has the option to set a few preferences with regard to how the Web Interface works in the preferences:
-
Use java for tool selection: Enabling this option will add a Tools column on the overview page. In this column, a Java-applet will appear, allowing you to select an external tool to use on the corresponding host. See Chapter 8 for more information.
Default value: Off
-
Disable navigation links at top of page: Enabling this option will result in the removal of the "breadcrumbs"-links at the top of the page. This can be useful when using the Web Interface on small screens.
Default value: Off
3.4. Paths
Paths are used by the SysOrb Network Monitoring System to alert users of problems with the nodes being monitored. In order for SysOrb to send an alert to a specific user, that user must have at least one Path configured.
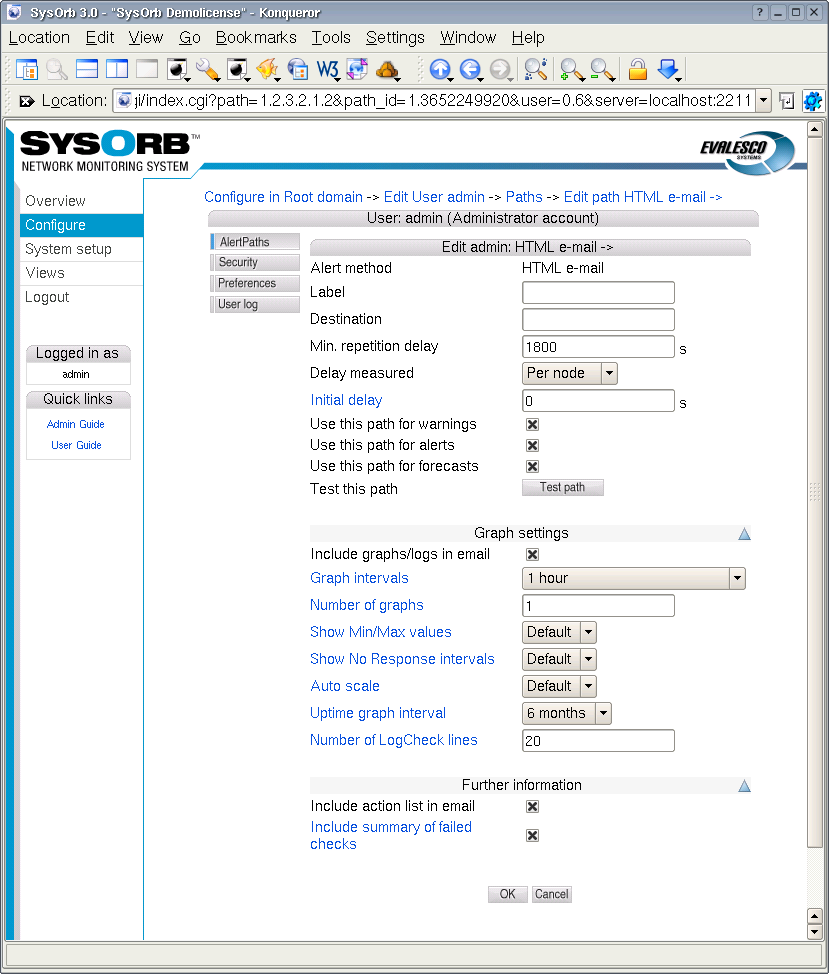
A path has the following properties:
-
Alert method: specifies how the user should be alerted: by e-mail, with an SMS message or through a numerical pager.
-
Send to: a string holding the destination of the alert. The interpretation depends on the alert method. For the 'HTML e-mail', 'SMS via. e-mail gateway' and 'Plaintext e-mail' methods this field should contain the e-mail addresses to send to. For 'Num. Pager' and 'Direct SMS' it should contain the number of the pager/phone to send to. For 'Custom' method the content of this field is made available to the script through an environment variable.
-
Suspend interval: defines the minimum time in second, that must pass between two alerts to this path regarding the same node/check. You should choose a minimum interval that will avoid spamming of e-mail accounts, cellular phones and pagers.
-
Suspend: The possible values are 'Per Node' or 'Per Check'. If you choose 'Per Node', then the suspend interval must pass between any two alerts concerning the same node, even though they concern different checks on that node. If you choose 'Per Check', then the suspend interval will only have effect on alerts about the exact same check.
-
Initial delay: When this value is set to anything other than zero, SysOrb will delay alerts and warnings using this path. Only when the check has been in warning or alert state for more than the specified period, will the first alert or warning be sent out.
-
Initial delay for ? notification: When this value is set to anything other than zero, SysOrb will delay notifications about checks for which no result is available using this path. Only when the check result has been unknown for more than the specified period will the first notification be sent.
-
Repeat every: If a check stays in the same (warning or alert) state for this period with no improvement, SysOrb will repeat the alert notification. If you choose 'No repetition' the SysOrb will only send alert notifications when a check changes state (for better or worse.)
-
Use this path for alerts: When this is selected this path can be used to notify an administrator about red alerts, you almost always want to enable this setting.
-
Use this path for warnings: When this is selected this path can be used to notify an administrator about yellow warnings, you may want to disable this setting for e.g. your SMS path, in order to have only the most severe events reported that way.
-
Use this path for ? notification: When this is selected this path can be used to notify an administrator about checks in an unknown state.
-
Use this path for ok notification: When this is selected this path can be used to notify an administrator about checks returning to the green OK state.
-
Use this path for forecasts: When this is selected this path can be used to send notifications based on statistical calculation, indications that something may go wrong in the near future.
If Alert method is Html e-mail, Plaintext e-mail or SMS the Destination field must be the e-mail address of a mailbox or a SMS gateway. If Alert method is Direct-SMS, the Destination is the cellphone number to receive the SMS-message. If Alert method is Numerical pager the field not only contains the number of the pager but also information on how long the delay is from a connection is made to the SysOrb can begin sending numbers to the pager. Consult Section 3.4.5 below for further information on how to accurately specify the Destination field.
Please note: In order to use Numerical pager a modem must be attached to the SysOrb Server, and the server must be configured to use it. In order to use Direct-SMS a GSM-modem must be attached to the server.
3.4.1. Adding paths to a user
To add a path to a user, do the following:
-
Select from the navigation buttons at the left.
-
Go to the domain where the user you wish to edit paths for is located.
-
Select the option for the user.
-
Press the button just below the list of paths.
-
Select the desired Alert method.
-
Specify the Destination of alerts sent to this path.
-
Define the Min. delay. The default value of 1800 should be appropriate in most situations and means that a specific check can only send alert messages every 1800 sec (= 30 minutes). This is to prevent the user from being flooded with alert messages.
-
Choose which types of alerts the path can be used to send.
-
Press the button to accept the new path or the button to cancel.
3.4.2. Testing paths
To test that alerts can be sent to a specified path, do the following:
-
Select from the navigation buttons at the left.
-
Go to the domain where the user you wish to test paths for is located.
-
Select the option for the user.
-
Select the option for the path to be tested.
A test message will now have been sent to the path and you should verify that it is received at the desired destination.
Please note: The time before the message arrives varies a lot. Especially with SMS-messages via. email-relays, the delivery time depends on your cellular network operator.
3.4.3. Editing paths
To edit a path, do the following:
-
Select from the navigation buttons at the left.
-
Go to the domain where the user you wish to edit paths for is located.
-
Select the option for the user.
-
Select the option for the path to be changed.
-
Make the needed changes.
-
Press the button to accept the changes or the button to cancel.
3.4.4. Deleting paths
To delete a path, do the following:
-
Select from the navigation buttons at the left.
-
Go to the domain where the user you wish to delete paths for is located.
-
Select the option for the user.
-
Select the option for the path you wish to delete.
-
You will be asked to confirm the deletion of the path. Press the button to delete the path and to keep the path.
3.4.5. Using Numerical Pagers
When configuring a path to notify a numerical pager, the string entered in the Destination field will be sent directly to a modem connected to the SysOrb Server. This means that you can use modem commands to bypass outgoing switchboards, wait if a message is being played by the machine answering the call and the like.
Some of the most common commands to use are:
-
w: tells the modem to wait for a dial tone before proceeding with the rest of the string. This is useful if you need to press a specific series of numbers to get an outside line.
-
, (comma): tells the modem to wait for two seconds before proceeding with the rest of the string. This is useful if the machine relaying the message to the numerical pager plays a voice message, eg. "Please dial your telephone number followed by a # sign after the beep". Several commas in a row will create a longer delay, two seconds per comma.
If, for example, you want the SysOrb to send the message
42 to a numerical pager with the
telephone number 12345678 and know
that you have to wait approximately 7 seconds before you can send
the actual message you would use the destination (assuming you
terminate the message with a #
sign):
12345678,,,,42#
Note: When using a numerical pager as a path you should first check how to dial the pager's number and the length of any needed pause between dialing the number and being allowed to leave a message. Also, you should check how the receiving machine expects the message to be ended.
3.5. Groups
SysOrb organizes Paths into groups to ease setting up which users should receive alerts concerning which nodes or checks. Each Path can be member of multiple Groups, but each node and check can be assigned only one group to which alerts should be sent.
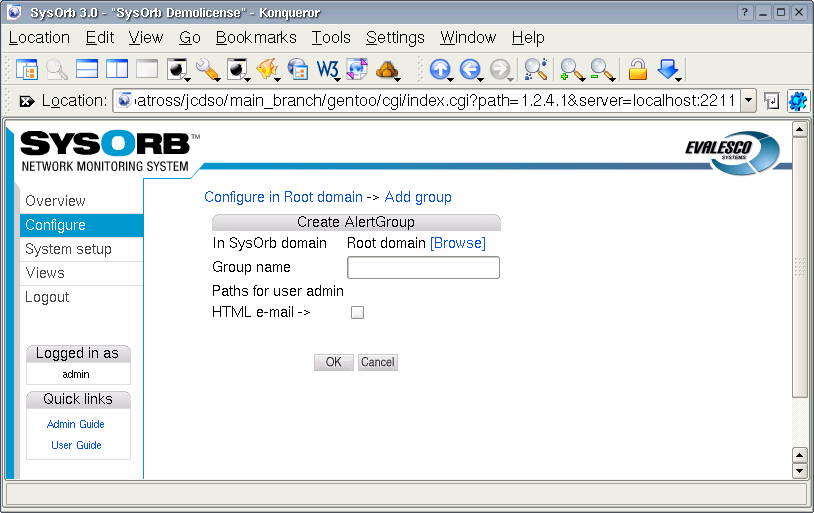
Each group contains the following information:
-
Group name: the name of the group
-
List of paths: a list of where messages should be sent when alerts are raised.
3.5.1. Adding groups
To add a new group to a domain, do the following:
-
Select from the navigation buttons at the left.
-
Click your way to the domain in which you wish to create a new group
-
Press the button.
-
Specify a Group name and select the paths that should be a part of this group.
-
Press the button to accept the new group or the button to cancel.
3.5.2. Editing groups
To edit a group, do the following:
-
Select from the navigation buttons at the left.
-
Click your way to the domain in which you wish to edit a group
-
Select the option for the group you wish to edit.
-
Change the groups name, and add or remove paths as needed.
-
Press the button to accept the changes or the button to disregard the changes.
3.5.3. Deleting groups
To delete a group, do the following:
-
Select from the navigation buttons at the left.
-
Click your way to the domain in which you wish to edit a group
-
Select the option for the group you wish to delete.
-
You will be asked to confirm the deletion of the group. Press the button to delete the group and to keep the group.
Chapter 4. Host/Node Management
Being able to configure what checks to run on which nodes is one of the key features in the SysOrb Web Interface. Basically there are three different kinds of checks you can configure:
-
NetChecks are checks that the SysOrb Server itself can perform to check the performance of a given service on a node. This means that the node being checked does not necessarily have the SysOrb Agent installed.
NetChecks range from simple ICMP ("ping") checks to mail server checks. It is not necessary for a node to be a SysOrb Agent in order for a NetCheck to work from the SysOrb Server.
-
AgentChecks are performed by the SysOrb Agent which reports the results of the performed checks on the host to the SysOrb Server.
These checks are performed by the SysOrb Agent and include checks on CPU load, free disk space, memory consumption and similar information.
-
snmpChecks are also checks performed by the SysOrb Server. This type of check can test gauges, counters and enumerations on SNMP capable devices, for example network printers, routers and intelligent switches.
Before you can configure the SysOrb Server to start monitoring a SysOrb Agent there are a few things you need to set up on the Agent. Please refer to the Administrator's Guide to the SysOrb Network Monitoring System for more information on how to configure a SysOrb Agent to check in to a specific SysOrb Server.
When adding or modifying node information the following are used to specify how the node will behave and when it will check in:
-
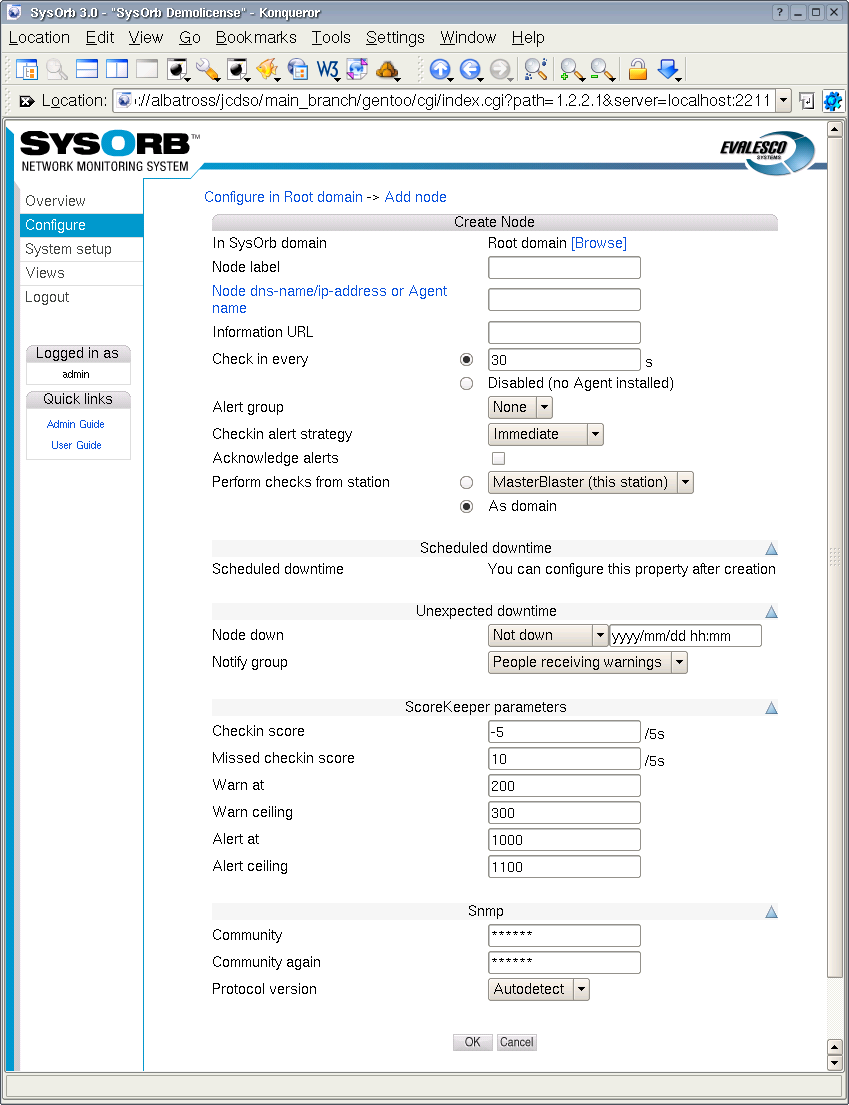
Node label: A name that you would like to see, on the various listings from SysOrb. SysOrb does not try to interpret this name in any way, it does not have to correpond to the DNS name or WINS name of the node.
-
Node dns-name/ip-address: The name by which the node will be recognized by the SysOrb Server.
Note: If you are preparing the SysOrb Server for a SysOrb Agent it is important that this name is exactly the same as the name specified in the configuration of the SysOrb Agent. If the two hostnames differ the SysOrb Server will reject the SysOrb Agent. See the Administrator's Guide for more information on how to configure the SysOrb Agent.
-
Information URL: If you have additional documentation regarding this node for the operators, you can supply an URL here, and SysOrb will show a link to the documentation on the various listings where this node appears.
-
Check in every: This is only used for SysOrb Agents. It tells the SysOrb Agent how often it should checkin. If you are configuring a node without the SysOrb Agent installed, you should set this value to Disabled
-
Alert group: The group to notify in case of warnings or alerts. When configuring checks, their default Alert group will be the same as this.
Possible values: None, As domain, AlertGroupX, AlertGroupY,...
Default value: None
-
Checkin alert Strategy: This allows you to select the method for determining when an administrator should be alerted about the Agent not checking in. The two possible values are Immediate and ScoreKeeper. Please refer to Section 1.3 for more information about how this works.
-
Scheduled downtime: Some nodes are only used in certain periods, for instance during working hours. SysOrb can be instructed only to send warnings and alerts during these periods. It will still perform the checks around the clock for statistical purposes, just not send warnings or alerts outside working hours.
You configure this by specifying all the time intervals of the week, for which SysOrb should not send warnings or alerts. For instance if you want SysOrb to monitor a server from 8 am to 4 pm every workday, you would add downtime intervals from 0:00:00 to 8:00:00 and from 16:00:00 to 23:59:60 on each of Monday to Friday, and one interval from 0:00:00 to 23:59:60 on Saturday and Sunday.
Note: If you have many nodes which should be monitored during the same set of intervals, you may consider putting those into a domain, and configuring scheduled downtime for the entire domain.
-
Unexpected downtime: When SysOrb detects a problem on a node, you sometimes know that someone will deal with it at some specific later time. You do not want to be flooded with SysOrb messages until then. In that case you can use these fields to instruct SysOrb not to send any warnings or alerts regarding this node until some later point in time.
Using the drop-down box labeled Node down you can select that the node will be down for 1, 3, 6 or 24 hours. You can also select the option named "Until", and enter a date and time in the text field to the right.
When enabling unexpected downtime you can choose to let SysOrb send a notification to anyone ordinarily receiving warnings or alerts regarding this node. This is accomplished using the Notify group drop-down box.
-
Community: This value specifies which SNMP community SysOrb should use when checking this node using SNMP.
-
Protocol version: SysOrb supports both SNMP version 1 and version 2. If you know which one your network equipment uses, you can specify it here before scanning the node. Otherwise SysOrb will first try version 2, and if the node does not reply to that, then version 1.
-
Port: If your SNMP equipment uses a port other than the standard 161, then you should enter it here, to make SysOrb issue its SNMP requests to that port for this Node.
-
Scan: When you click this button, SysOrb will perform an SNMP walk of the node, thus making snmpChecks available on this node.
After the scan, if you think that SysOrb did not find all the possible checks that you think the network equipment supports, you may want to inspect the incident log of the node. It will show if SysOrb skipped something, because it does not have the required MIB's, if that is the case you can consult the Administrators Guide for an explanation on how to import MIB-files into SysOrb. You find the incident log by clicking Overview on the left navigation bar and hitting the button labeled Incident log.
Apart from these options it is also possible to define how the score of a node should be modified by how different checks turn out. This is done through the Score system as described in Section 1.3. The signed values defined in the options below are added to the score of the host/node when a check succeeds or fails.
-
Checkin score: This is added every five seconds whenever the last checkin was on time. (must be negative)
-
Missed checkin score: This is added every five seconds whenever the Agent has exceeded its timeframe for checking in. (must be positive)
-
Warn at: When the node's score or the score of one of its checks, is above this level a warning message will be sent to the appropriate paths.
-
Warn ceiling: Checks resulting in warnings can never result in a score exceeding this limit.
-
Alert at: When the node's score or the score of one of its checks is above this level an alert message will be sent to the appropriate paths.
-
Alert ceiling: Checks resulting in alerts can never result in a score exceeding this limit.
Note: The above values for the node warning and alert levels are aligned with how the checks modify the node's score and their default values are reasonable. If you decide to change these values make sure you consider the new values carefully since incorrect values may result in too many or too few warnings and alerts. See Section 1.3 for more information on how scores work.
The page can also contain a button to release the key, that the server holds for the SysOrb Agent. This key is negotiated when the SysOrb Agent contacts the SysOrb Server for the first time, so it can be used to authorize the agent the next time it checks in. If the agent is reinstalled and has lost its key it is necessary to release the key, in order for the SysOrb Server to allow the Agent without providing a key. It it also necessary to release the key, if you have deinstalled the SysOrb Agent from a host, and you wish to move the SysOrb Agent license to another host.
4.1. Monitoring a New Node
Before you can begin monitoring using either AgentCheck, NetChecks or snmpChecks, you create a node in SysOrb by following these steps:
-
Select the button from the navigation buttons at the left.
-
Select the domain in which you wish to create a new node.
-
Select the button.
-
Specify the Node dns-name/ip-address
-
If you are not going to install a SysOrb agent on the host, select Disabled in the Checkin frequency field. Otherwise select a frequency at which it should check in to the server.
-
Modify other parameters, if you want. The defaults should suffice for most users though.
-
Press the button to accept the new node or the button to discard it.
4.2. Reconfiguring a Node
To reconfigure the settings of a node, do the following:
-
Select the button from the navigation buttons at the left.
-
Select the option for the node you wish to reconfigure.
-
Change the node parameters.
-
Press the button to accept the changes or the button to discard the changes.
Again, remember to be careful when changing the options that modify the node's scores.
4.3. Deleting a Node
In order to delete a node, do the following:
-
Select the button from the navigation buttons at the left.
-
Navigate to the domain in which the node you wish to delete is placed.
-
Click the link, placed to the right of the node.
-
You will then be asked to confirm your action. Choose in order to proceed with the deletion, and to abort the deletion.
Once the node is deleted, all the licenses used by the node will also be released, and can be used for another node.
4.4. Setting Up Checks
Before the SysOrb Server can tell you what problems, if any, there are on your network, you need to tell the SysOrb Server what to monitor. The results of all types of checks are stored by the SysOrb Server and are checked to see if the host in question is behaving as expected. If abnormal behavior is detected a warning or alert will be raised.
4.4.1. NetChecks
These checks can be performed without a SysOrb Agent being installed.
NetChecks on services are performed by using one of these 8 protocols:
-
DNS: Asks a DNS-server to translate a hostname to an IP-address, and matches the returned IP-address with a user specified list of valid IP's.
-
FTP: Tries to log on the node's FTP-server with a specified username and password. If no username is specified, it is only checked that the FTP-banner is returned.
-
HTTP: Connects to an HTTP server on the node and tries to retrieve an URL defined as part of the check.
-
ICMP: Sends an ICMP PING to the node and listens for a reply. This is basicly the same as the ping-program does.
-
IMAP: Connect to the node and examines whether the IMAP server is running or not. This is done by logging in and logging out again.
-
POP3: Connect to the node and examines whether the POP3 server is running or not. This is done by logging in and logging out again.
-
SMTP: Connects to the node and examines whether there is an SMTP server running there or not.
-
Generic TCP: This simply tries to make a TCP connection to the specified port on the node. If a connection can be opened this check is considered successful.
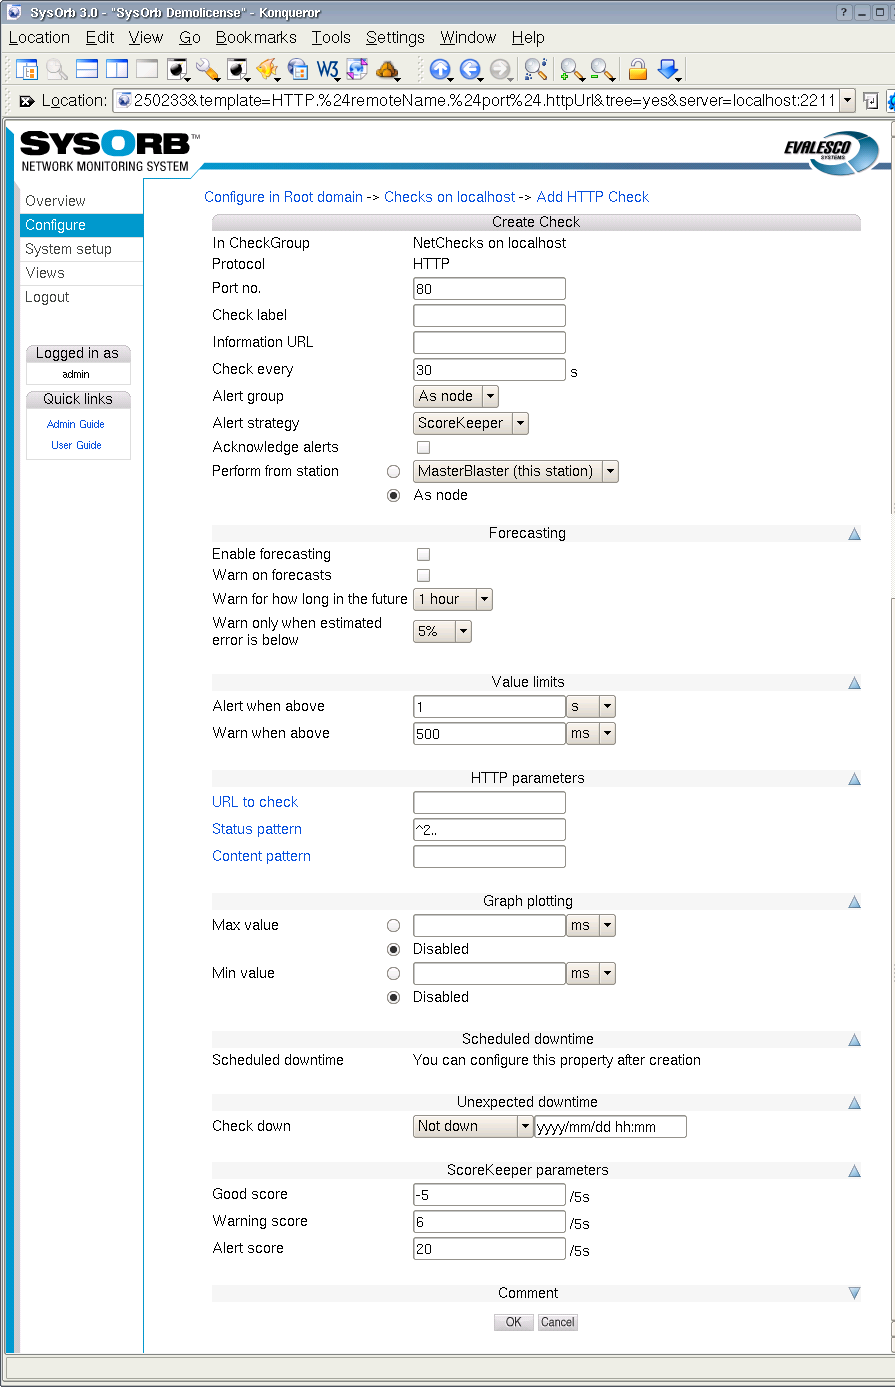
When setting up a NetCheck you can set the following options:
-
Port no.: The port the SysOrb Server should perform the check on. For ICMP checks this option does not exists.
Default value: (Depending on type of check)
-
Check name: A name by which you will recognize the check.
Default value: (empty)
-
Information URL: If you have additional documentation regarding this check for the operators, you can supply an URL here, and SysOrb will show a link to the documentation on the various listings where this check appears.
-
Check every: Number of seconds between each time this check should be performed.
Default value: (Depending on type of check)
-
Alert group: When a warning or alert is raised this group will be notified.
Possible values: None, As node, As domain, AlertGroupX, AlertGroupY,...
Default value: As node
-
Alert Strategy: This allows you to select the method for determining when an administrator should be alerted about this check. The two possible values are Immediate and ScoreKeeper. Please refer Section 1.3 for more information about how this works.
-
Acknowledge alerts: When this option is checked, the check will never return to the good state automatically. This is instead done manually by an administrator. This is especially usefull for LogChecks. For more information please refer to Section 1.3.
-
Enable forecasting: When this box is checked, SysOrb will try to generate forecasts about how this check will behave in the future. These forecast will be visible when viewing a graph of the check, by scrolling into the future. Please refer to Chapter 9 for a full description on setting up forecasting.
-
Warn on forecasts: Enabling this option, will allow the forecaster to send out warnings concerning this check, if the forecast shows that the check will fail in the future. The warning is sent out whenever the forecaster completes a forecast. This happens once every half hour.
-
Warn for how long in the future: This function tells the forecaster, for how long in the future it should check that the forecast is within the bounds specified for the check. Only the time-interval specified here will be checked.
-
Warn only when estimated error is below: This option allows you to finetune how certain the forecaster should be, before the alerts are sent out.
-
Alert when above: If the response time of the check is longer than this value we consider this check seriously unsuccessful and raise an alert.
Default value: (Depending on type of check)
-
Warn when above: If the response time is below this value we accept the check as successful. If the response time is above this value we raise at least a warning if not an alert, as above.
Default value: (Depending on type of check)
-
Min value: When this value is set, the lowest displayed value whenever a graph for this check is being drawn, is fixed at this value.
-
Max value: When this value is set, the greatest displayed value whenever a graph for this check is being drawn, is fixed at this value.
-
Scheduled downtime: Some checks are only relevant in certain periods, for instance during working hours. SysOrb can be instructed only to send warnings and alerts during these periods. It will still perform the checks around the clock for statistical purposes, just not send warnings or alerts outside working hours.
You configure this by specifying all the time intervals of the week, for which SysOrb should not send warnings or alerts. For instance if you want SysOrb to monitor a server from 8 am to 4 pm every workday, you would add downtime intervals from 0:00:00 to 8:00:00 and from 16:00:00 to 23:59:60 on each of Monday to Friday, and one interval from 0:00:00 to 23:59:60 on Saturday and Sunday.
Note: If all checks on a node should be monitored during the same set of intervals, you can set up the downtime intervals for the node, instead of for each check.
-
Unexpected downtime: When SysOrb detects a problem on a check, you sometimes know that someone will deal with it at some specific later time. You do not want to be flooded with SysOrb messages until then. In that case you can use these fields to instruct SysOrb not to send any warnings or alerts regarding this check until some later point in time.
Using the drop-down box labeled Node down you can select that the check will be down for 1, 3, 6 or 24 hours. You can also select the option named "Until", and enter a date and time in the text field to the right.
-
Good score: This value is added to the check's score every five seconds, if the last check was successful, i.e. if the response time was below Warn when above.
Default value:
-5 -
Warning score: This value is added to the check's score every five seconds, if the last check resulted in a warning, i.e. if the response time is between Warn when above and Alert when above.
Default value:
6 -
Alert score: This value is added to the check's score every five seconds, if the last check resulted in an alert, i.e. if the response time is higher than Alert when above.
Default value:
20
In addition to these, some of the NetCheck types require extra parameters.
-
ICMP, SMTP: No extra parameters.
-
HTTP: For the HTTP check you can specify which URL it should check.
Depending on how the node is configured, this can be done in several ways. There is only one domain hosted on the server, you can type the path to the page that SysOrb should retrieve, e.g. /secret/web-db-test.php.
If the node is configured to host several web-sites, you can specify the entire URL, e.g. http://www.mydomain.com/secret/web-db-test.php
Note: The return code for the page that SysOrb checks, must be one of the 200-codes. E.g. an URL that redirects the browser to another page, will result in failure of the check, as will a page that does not exist.
-
IMAP, POP3, FTP: You may optionally specify the login and password of an account on the monitored server. If one is given SysOrb will try to log in and perform some basic operation (like listing the mails/files). If not SysOrb will just connect to the server, and wait for the login prompt.
-
DNS: You must supply a dns-name to be resolved, and a comma separated list of numerical IP addresses. The check is considered successfull if the monitored server resolves the dns-name to one of the given IP addresses.
Note: The default values of dnstest.sysorb.com and 10.0.0.42 is a service, which allows you to check the external DNS resolution works as it should. These values are guaranteed not to change.
-
Generic TCP: You must specify if SysOrb should also wait for the connection to close, after it has been opened. Most server applications detects immediate hang-up from the client, and closes willingly. But some do not, and the check fails if you do not specify that SysOrb should not wait for the connection to close.
To enable a NetCheck on a node, do the following:
-
Select the button from the navigation buttons at the left.
-
Navigate through the domain tree until you reach the domain where the node is located
-
Select the Edit option for the node you wish to configure a new NetCheck on.
-
Press the button on the left.
-
Select the type of check that you wish to add, by pressing the appropriate button.
-
Specify the check parameters for the NetCheck.
-
Press the button to add the NetCheck to the chosen node or the to discard the check.
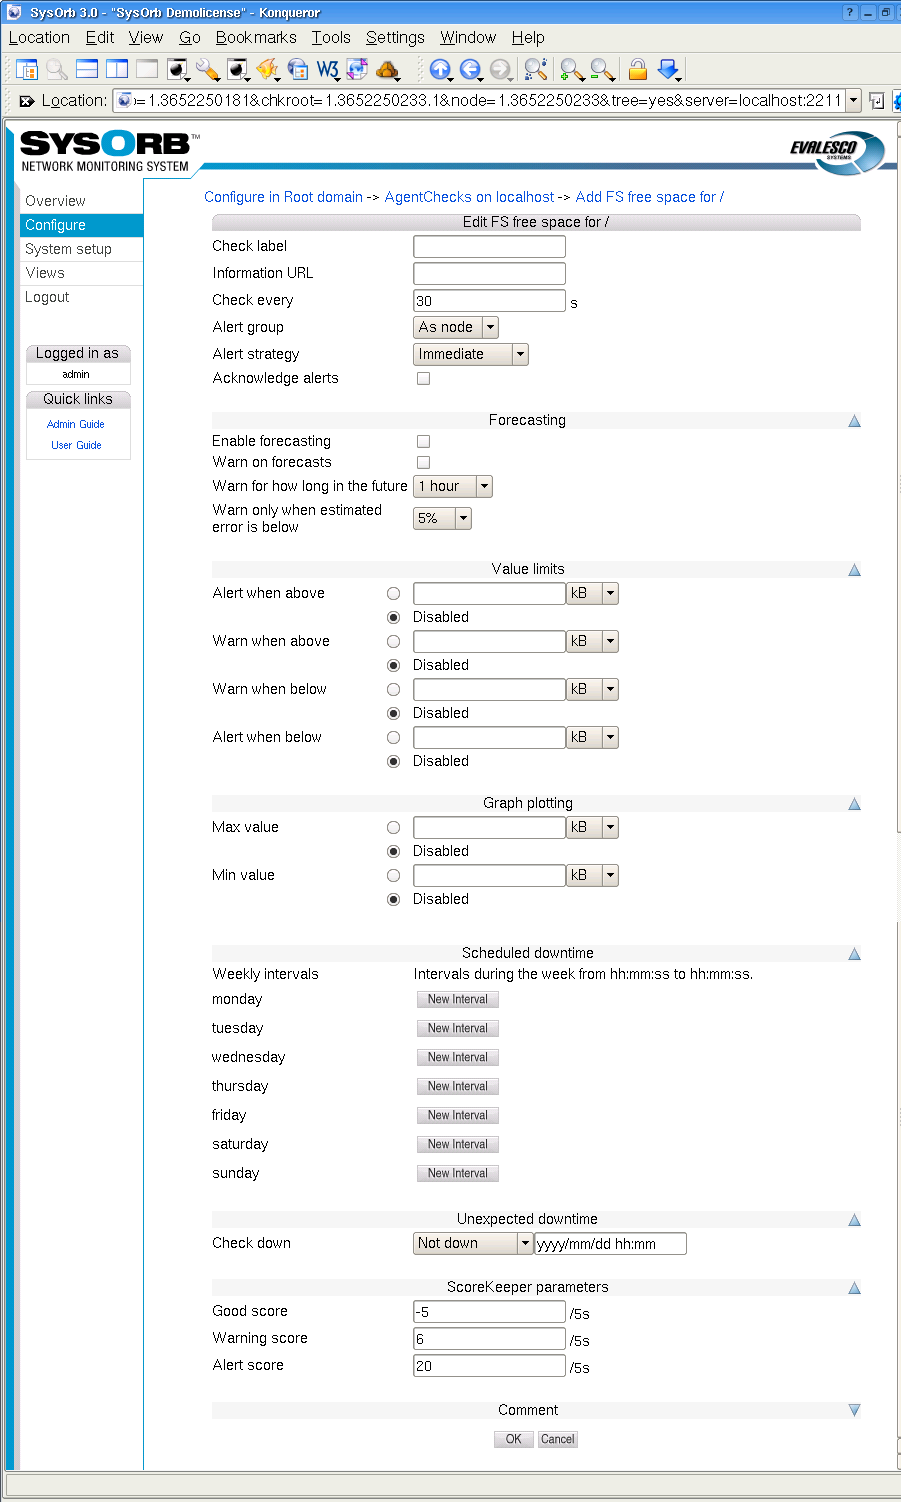
4.4.2. AgentChecks
In SysOrb the term AgentCheck covers a number of things on a host machine that can only be checked by the host itself by running the SysOrb Agent on it. Some of the checks you are able to monitor on hosts running SysOrb Agents are:
-
Free space: Monitors the amount of free space on hard drives and the like on the host.
-
Free memory: Monitors the amount of free virtual and physical memory as well as available swap space.
-
System Load Average: The average system load (Unix).
-
Process presence: Check whether a named process is running on the host.
-
System Uptime: The time that has passed since the system was last booted.
-
Logs: The SysOrb Agent can scan log files, and report whenever a line matches given patterns.
Depending on the operating system of the host running the SysOrb Agent, it may support many other types of AgentChecks. Please consult the SysOrb brochure for the full list.
Any AgentCheck belongs to one of three groups. One group results in a numerical value, such as free space, load, temperature etc., we call these checks continuous. The other group results in one of a number of cases, such as processes (present, absent), RAID (OK, degraded, failed) etc., we call these checks enumerations. The last group is the LogChecks, which return a line.
All AgentChecks share the common configuration options listed below.
-
Information URL: If you have additional documentation regarding this check for the operators, you can supply an URL here, and SysOrb will show a link to the documentation on the various listings where this check appears.
-
Check every: Number of seconds between this check should be performed.
Default value: 30
-
Alert group: If this check results in a warning or an alert being raised this group will be notified.
Possible values: None, As node, As domain, AlertGroupX, AlertGroupY,...
Default value: As node
-
Alert Strategy: This allows you to select the method for determining when an administrator should be alerted about this check. The two possible values are Immediate and ScoreKeeper. Please refer Section 1.3 for more information about how this works.
-
Acknowledge alerts: When this option is checked, the check will never return to the good state automatically. This is instead done manually by an administrator. This is especially usefull for LogChecks. For more information please refer to Section 1.3.
-
Enable forecasting: When this box is checked, SysOrb will try to generate forecasts about how this check will behave in the future. These forecast will be visible when viewing a graph of the check, by scrolling into the future. Please refer to Chapter 9 for a full description on setting up forecasting.
-
Warn on forecasts: Enabling this option, will allow the forecaster to send out warnings concerning this check, if the forecast shows that the check will fail in the future. The warning is sent out whenever the forecaster completes a forecast. This happens once every half hour.
-
Warn for how long in the future: This function tells the forecaster, for how long in the future it should check that the forecast is within the bounds specified for the check. Only the time-interval specified here will be checked.
-
Warn only when estimated error is below: This option allows you to finetune how certain the forecaster should be, before the alerts are sent out.
-
Min value: When this value is set, the lowest displayed value whenever a graph for this check is being drawn, is fixed at this value.
-
Max value: When this value is set, the greatest displayed value whenever a graph for this check is being drawn, is fixed at this value.
-
Scheduled downtime: Some checks are only relevant in certain periods, for instance during working hours. SysOrb can be instructed only to send warnings and alerts during these periods. It will still perform the checks around the clock for statistical purposes, just not send warnings or alerts outside working hours.
You configure this by specifying all the time intervals of the week, for which SysOrb should not send warnings or alerts. For instance if you want SysOrb to monitor a server from 8 am to 4 pm every workday, you would add downtime intervals from 0:00:00 to 8:00:00 and from 16:00:00 to 23:59:60 on each of Monday to Friday, and one interval from 0:00:00 to 23:59:60 on Saturday and Sunday.
Note: If all checks on a node should be monitored during the same set of intervals, you can set up the downtime intervals for the node, instead of for each check.
-
Unexpected downtime: When SysOrb detects a problem on a check, you sometimes know that someone will deal with it at some specific later time. You do not want to be flooded with SysOrb messages until then. In that case you can use these fields to instruct SysOrb not to send any warnings or alerts regarding this check until some later point in time.
Using the drop-down box labeled Node down you can select that the check will be down for 1, 3, 6 or 24 hours. You can also select the option named "Until", and enter a date and time in the text field to the right.
-
Good score: If the check is successful this value is added to the check's score.
Default value:
-5 -
Warning score: If the check exceeds the warning tresholds, as specified above, this score is added to the check's score.
Default value:
6 -
Alert score: If the check exceeds the alert tresholds, as specified above, this score is added to the check's score.
Default value:
15
In addition to these settings continuous AgentChecks have the following options. The appropriate units depending on the actual check, e.g. MB for free disk space, are listed to the right of these fields.
-
Alert when above: If the monitored value climbs above this threshold an alert will be raised.
Default value: Disabled
-
Warn when above: If the monitored value climbs above this threshold a warning will be raised.
Default value: Disabled
-
Warn when below: If the monitored value drops below this threshold a warning will be raised.
Default value: Disabled
-
Alert when below: If the monitored value drops below this threshold an alert will be raised.
Default value: Disabled
Note: When the value crosses any of these boundaries, a warning or alert may not be sent immediately. This depends on the Alert Strategy setting, and the score settings if the ScoreKeeper strategy is selected. Please refer to Section 1.3 for an explanation.
Enumeration AgentChecks have one option for each state the check may result in. That option determines if a warning or alert is to be be raise, should the check result in the given state. The possible settings for each state are Good, Warn or Alert.
When deciding on warning and alert tresholds be sure to choose meaningful values. For example, if you monitor a database server with approximately 10GB data on a 15GB device it would not make sense to raise an alert when there is less than 1GB free space. The other way around it would make sense to raise a warning, or possibly an alert, if there is more than 10GB free space as this might be caused by unexpected loss of data in the database.
As noted above all thresholds are disabled by default which means that when enabling a AgentCheck you need to consider not only what to monitor but also how you monitor it. Even if you create a check, with all the thresholds disabled, you will still be able to view the graphs for the device, so this is a good way to document how much a machine is stressed.
To enable an AgentCheck on a host, do the following:
-
Select the button from the navigation buttons at the top.
-
Browse into the domain containing the host in question.
-
Select the Edit option for the host you wish to configure a new AgentCheck on.
-
Press the button on the left.
-
Press the button to get a tree of all AgentChecks found by the Agent.
-
Press the button to configure an AgentCheck.
-
Specify the check parameters for the AgentCheck.
-
Press the button to add the AgentCheck to the chosen host or the to cancel.
4.4.2.1. LogChecks
The SysOrb Agent can scan log files for error messages, or for unexpected messages. Before you are able to configure any LogChecks, you will need to tell the Agent which files may be monitored. This is a safety measure, guarding agaist a compromised SysOrb Server being able to retrieve a copy of any file on the hosts running SysOrb Agents. (See the Administrator's Guide for more information on how to configure the SysOrb Agent to allow LogCheck).
If you see a group called LogChecks beneath AgentChecks, then you are ready to go on. Browse through the directories below the LogChecks group to find the file you want to monitor.
When scanning a log file, the Agent will start from the position where it stopped the last time. (End of file at that time.) That means that scanning the log file frequently (e.g. every 30 seconds) does not mean, that the entire file is read through twice every minute.
The Agent must know how to separate the entries of the log files. Many log files contain one entry per line, other separate the entries by a line with only dashes, or by an empty line. This can be configured for each log file in the web interface.
After splitting the log file into entries, the Agent will look at one entry at a time, and based on a set of rules determine whether that particular entry should be reported to the SysOrb Server, and if it is a warning or alert, or just an informational message.
How to split the entries, and the rules to apply to each of them afterwards is specified through the following configuration options specific for LogChecks:
-
Separator: A POSIX regular expression that describes the separator text between two adjacent log entries. The default '\r?\n' is to use each new line as a log entry.
Please Note: Certain characters must be prepended with a backslash (i.e. \), if they are to be used to specify a separator. These are:
. [ \ ] ( ) * ^ $ + ? { }
|
For more information about regular expressions, please see http://www.regular-expressions.info/tutorial.html
Default value: \r?\n
-
Separator inclusion: This field can take one of three values, that determines what to do with the log entry separator. It is only useful if your separator pattern may match something non-trivial, that you want to include with the log entry. "Append to previous entry" will append the separator to the entry just before the separator. "Prepend to next entry" will prepend the separator to the next entry found. "Discard the separator" will just throw away the separator and only consider the text between separators as entries.
Default value: Discard the separator
-
Rules: This text box is used to enter rules. The rules specifies which log entries that should be handled, and what to do with them. Each rule is terminated by a semicolon and consists of two parts separated by a colon.
An example of a rule could be 'Error': alert log;. This rule will make sure that all lines containing the string Error (case sensitive) will result in an alert, and be logged in the database.
The left part of the rule specifies which log entries should match this rule. The syntax is that of a POSIX regular expression enclosed in single quotes. It is also possible to have a number of regular expressions separated by and, or. Any regular expression can optionally be preceeded by not. Example: 'Error on' and 'Drive' and not 'empty', will match entries containing both Error on and Drive in no particular order, but not containing the the string empty anywhere.
The right part of the rule specifies what to do with an entry matching the rule. It can be one of the states: ok, warm, or alert, followed by one of the actions: log or quiet, which tells whether the entry should be logged on the SysOrb Server in order for you to view later.
Another example of a rule could be '[Ee]rror': alert log;. This rule will make sure that all lines containing either the string Error or error, will result in an alert, and be logged in the database.
If multiple applications write into the same log (e.g. the Windows Event Log) you may want to split that log into multiple LogChecks, which will show warning and errors individually on overview pages and mail notifications. This can be achived with the LogCheck forwarding feature of SysOrb.
Example of forwarding: '^[^:]*:Browser:': moveto 'Browser'; this will cause all entries having Browser between the first and second colon on the line to be moved into a LogCheck called Browser (which will be created if it does not exists). The moved entries will be processed through all of the rules of the LogCheck called Browser, and be logged over there if the rules says so. The entries will not be processed through the remaing rules of the originating LogCheck, in order for this to happen use copyto instead of moveto.
You can insert comments in the list of rules by starting a line with '#'. SysOrb will ignore these lines when processing the log.
Default value: Empty
When configuring a new LogCheck you can start by putting the catch-all rule '.*': ok log; as the very last (or maybe only) one. That will log everything to the SysOrb server. You will probably quickly find out a number of messages, that you do not want to see in the web interface. You should put the rules for those above the catch-all rule, that way any unexpected message will still turn up in the web interface, for you to decide if it should be ignored or not. After a while you could even modify the catch-all rule to result in warnings if any unexpected messages turn up.
4.4.2.1.1. Event Log checks
A SysOrb agent running on Windows is able to check the Event Logs in addition to text log files. Event Logs are handled slightly different than ordinary log files
Checking of any Event Log is enabled per default on the SysOrb agent. If you consider it a security problem that SysOrb users will be able to configure a check on for instance the security Event Log on all your machines, then you should disable this feature on the Agent, before starting it. See the Administrator's Guide for more information on how to configure the SysOrb Agent with respect to which files will be permitted for LogChecks.
First off, the Event Log is already divided into separate entries, and thus SysOrb does not need a separator pattern to find out when one entry ends and the next begins.
The other difference is that an Event Log entry has more to it than a simple string of text, but the regular expressions in the rules are only able to handle strings. Therefore the SysOrb agent converts every Event Log entry into a string in the following way.
The Agent composes a colon-separated string of the following form: type:source:category:event_id:user:computer:description for instance: Information:SNMP:0:1001:N/A:MyComputer:The SNMP Service has started successfully.
This string is then tested against the patterns in the rules, and sent to the server if it matches.
A very simple rule could look like this:
'SNMP': warn log;
The pattern matches every string containing SNMP. And causes it to be logged with a yellow warning icon. The above example string contains SNMP (twice), so that would be logged.
This rule is a bit too simple, as it would also match unrelated Event Log entries, which happen to contain the word SNMP somewhere in the desription text. (That could just be part of a filename.) We really want the rule to match only entries, whose source is SNMP. That can be done, but first we will consider a simpler case.
In this rule
'^Information': ok quiet;
the caret causes the pattern to match only when the word Information appears at the very beginning of the string. This will match all information type messages, without catching errors or warnings, which happen to contain the word Information in the description text.
We can now proceed with the SNMP example:
'^Error:SNMP:': alert log;
This pattern will match all strings beginning with Error:SNMP:, i.e. error messages whose source is SNMP. (As source is the second field in the colon delimited string.)
To catch both errors and warnings related to SNMP one can write:
'^(Warning|Error):SNMP:': alert log;
The pipe and parenteses mean that either Warning or Error must preceed the first colon in order for this pattern to match.
If you want to match every record from the SNMP source, regardless of the event type, you can use the regular expression [^:]*, which matches any number of characters as long as there are no colons among them. This can be used in a rule like this:
'^[^:]*:SNMP:': alert log;
The wildcard can be used more than once in a singe rule, for instance if we want to catch event number 6009 from the SNMP source. SysOrb places the event number as the fourth field in the colon delimited string, so we do not care about the first and third field, only the secon and fourth. This can be achived with the following pattern:
'^[^:]*:SNMP:[^:]*:6009:': alert log;
4.4.3. snmpChecks
If a node supports the SNMP protocol it is possible to monitor the node using that. SNMP can provide much more information than NetChecks, but does not require installation of extra software like AgentChecks. This is useful for monitoring SNMP aware printers/switches/routers/firewalls, but can also be used to monitor a ordinary computers.
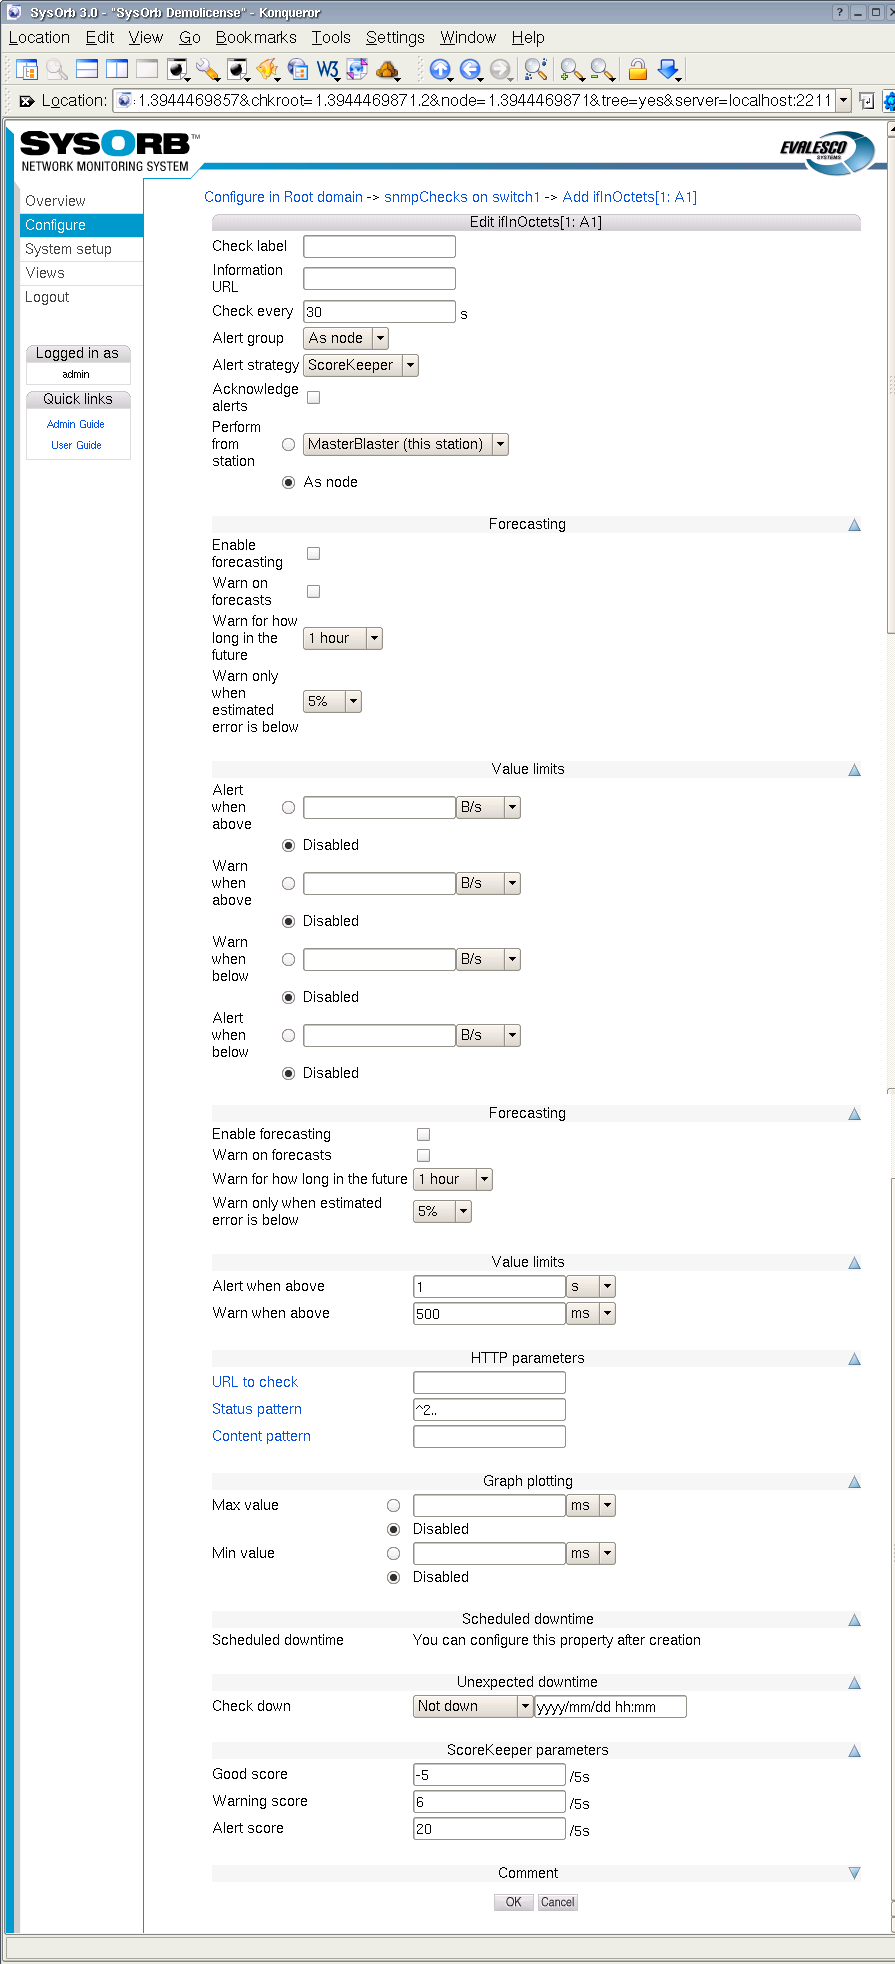
To enable an snmpCheck on a node, do the following:
-
Select from the navigation buttons at the left.
-
Select the domain containing the node you wish to enable snmpChecks on.
-
Select the option for the node you wish to edit.
-
Select the option.
-
Select the button.
-
If you see no checks in the list, you need to scan the SNMP capabilities of the node. Click the button at the bottom of the page to start the scan. The scanning usually takes a few minutes, watch the Incident log to be sure. A log messages will be inserted when the scanning starts and when it completes.
-
Browse the tree to find the item to monitor and select . If there are no checks in the tree, then go back to the , and select for the node. In there write the correct Community and Password and press the button.
-
Configure the check.
-
Press the button to accept the changes or the button to discard the changes.
snmpChecks are like AgentChecks grouped into continuous and enumeration. The configuration parameters are equal to those of the AgentChecks, please refer to Section 4.4.2 for a thorough description.
4.4.4. Cumulative checks
Some SysOrb checks measures events per second or bytes per second, when what you really want to know is the total number of events/bytes in one day, week or month. If this is the case, you can use cumulative checks.
If you want to monitor the monthly traffic on a switch or router port for instance, you should first configure ordinary checks on ifInOctets and ifOutOctets on the port in question. You do not have to configure any alert limits on the check itself.
You should then see an option called to the right of the newly enabled check. Click that link, and you will be presented with a configuration dialog with options for the accumulation, that you are about to create.
-
Accumulation period: This allows you to selec the period for which to accumulate data from the check. Possible values are: 1 day, 1 week, 1 month, 3 months, 6 months, 1 year.
Default value: 1 month
-
Rolling accumulation: SysOrb support two types of accumulations: rolling or calendar. A monthly rolling accumulation will sum the traffic for the last 30 days, e.g. from 3 pm April 15th to 3 pm May 15th. A monthly calendar accumulation will sum the traffic from the start of the current month to now, e.g. from midnight May 1st to 3 pm May 15th.
Default value: Disabled (calendar accumulation)
-
One shot alert: This field applies only to calendar accumulations. When you have configured upper limits to the accumulated traffic, and that limit has been reached halfway through the accumulation period, then you may not want to continually receive alerts because of the accumulation, which cannot possible drop below the limit before the start of next accumulation period (when the sum is reset.)
Note: Emails and SMS'es are inherently unreliable. If you enable one shot alerts, and the email get lost, you will never receive notifacation about the condition. Alternatively you can refrain from enabling one shot alerts, and instead make use of unexpected downtime whenever you receive alerts from the accumulation.
Default value: Disabled
The rest of the options works as for ordinary checks. Only that Warn when below and Alert when below does not make sense for calendar accumulations, as they would always trigger when the sum is reset at the beginning of every month (or whatever period is selected.)
4.5. Dependencies
SysOrb can maintain dependencies between checks an/or nodes, in order to limit the amount of alerts sent to administrators when faults occur. For example, when a backbone router is down, there is no point in alerting everyone that ICMP (ping) checks to all nodes behind the backbone router are failing. Dependencies allow SysOrb to "filter out" alerts from nodes that are marked as depending on other failing nodes or checks.
4.5.1. Implicit dependencies
There are both implicit and explicit dependencies in the system. Implicit dependencies are dependencies that SysOrb knows will invariably exist - they cannot be configured in any way.
The following implicit dependencies exist in the system:
-
Exported domains depend on the synchronization status between the master and the importing satellite. No remote check/node alerts are sent if the domain is not synchronized.
-
Agent Checks depend on the Agent Checkin status. No agent check alerts are sent if the agent does not check in.
The picture illustrates an exported domain, with a number of nodes. The domain synchronization has failed (marked with a red cross in the "checkin" column), and the implicit dependencies in SysOrb now cause all actual checks performed on nodes in the domain to be marked as "Dependent".
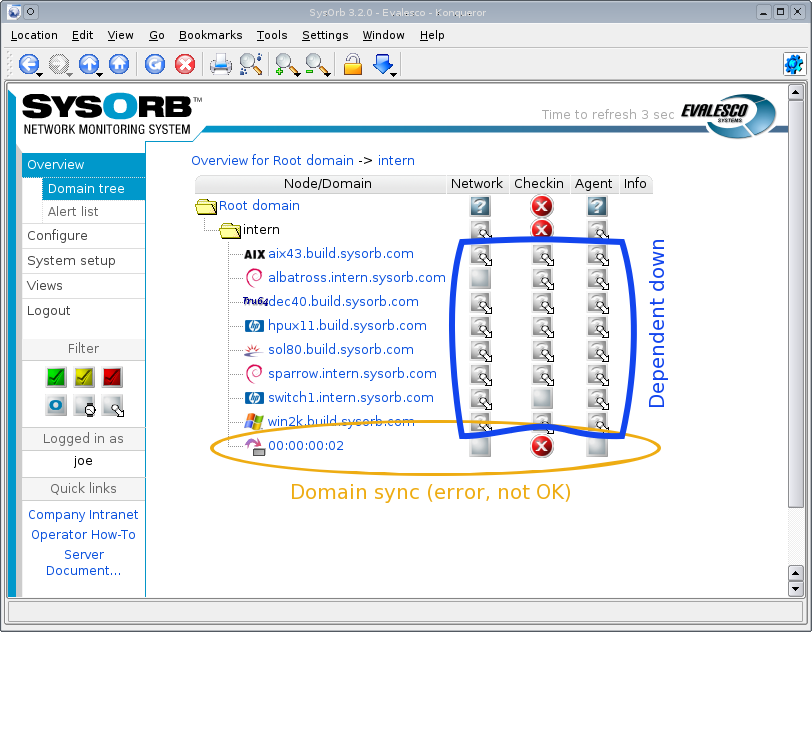
The end result is, that administrators will receive alerts on the failing domain sync, but they will not receive alerts on all nodes and checks inside the domain. This lets the administrators focus on the actual problem at hand, rather than being overwhelmed with alerts from hundreds or thousands of checks that cannot be performed (because of the failing sync).
4.5.2. Explicit dependencies
There is no mechanism in SysOrb (yet) to automatically determine relationships between checks and nodes, across a large site setup (short of the previously mentioned implicit dependencies). It is therefore up to the administrators to explicitly configure in the system which dependencies there exist between nodes and checks.
Remember, dependencies are a tool to help "filter out" irrelevant alert messages - SysOrb will function without the dependencies set up, but once set up they can significantly improve the quality of the alerts from SysOrb by limiting the number of irrelevant alerts being transmitted.
4.5.3. Simple dependency setup
In this example we will configure a dependency between an office firewall and the local LAN switch. The SysOrb Server is located on the LAN, and it follows that SysOrb cannot check the firewall if the LAN is down.
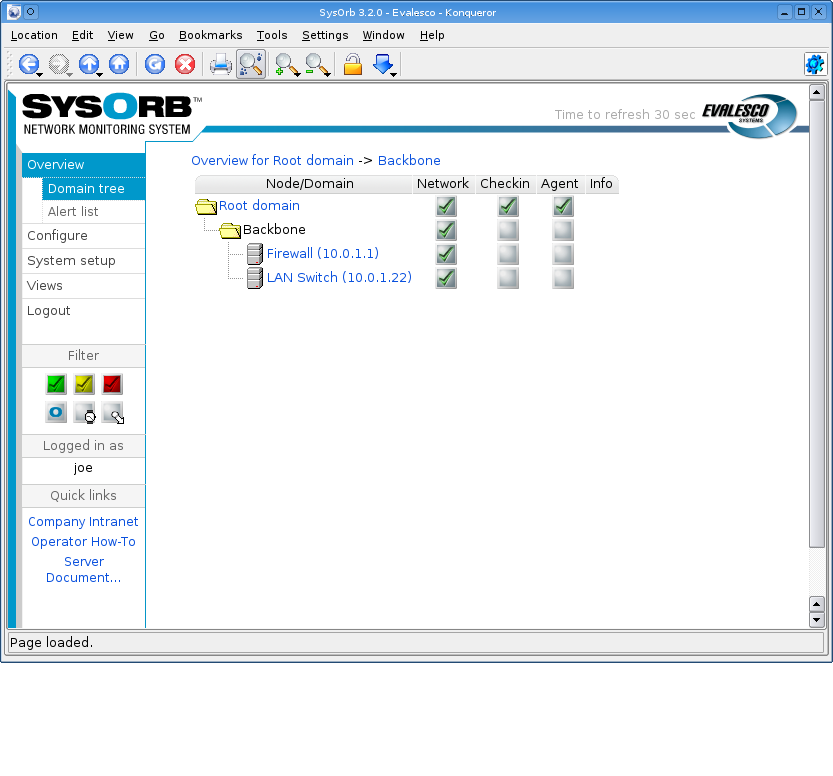
In order to keep this example very simple, we have only configured an ICMP (ping) check on the firewall and one on the LAN switch. We wish to set up a dependency so that the firewall ICMP check depends on the LAN switch ICMP check - so, if the firewall fails we will receive alerts on that, but if the LAN switch fails we will only receive alerts on the LAN switch failure, not from the firewall ICMP check (which will also fail because SysOrb cannot ping the firewall when the switch is down).
Now, we press , and choose to edit the Firewall node. Under we click the checkbox next to the ICMP check, and notice that the button at the bottom of the screen is activated.
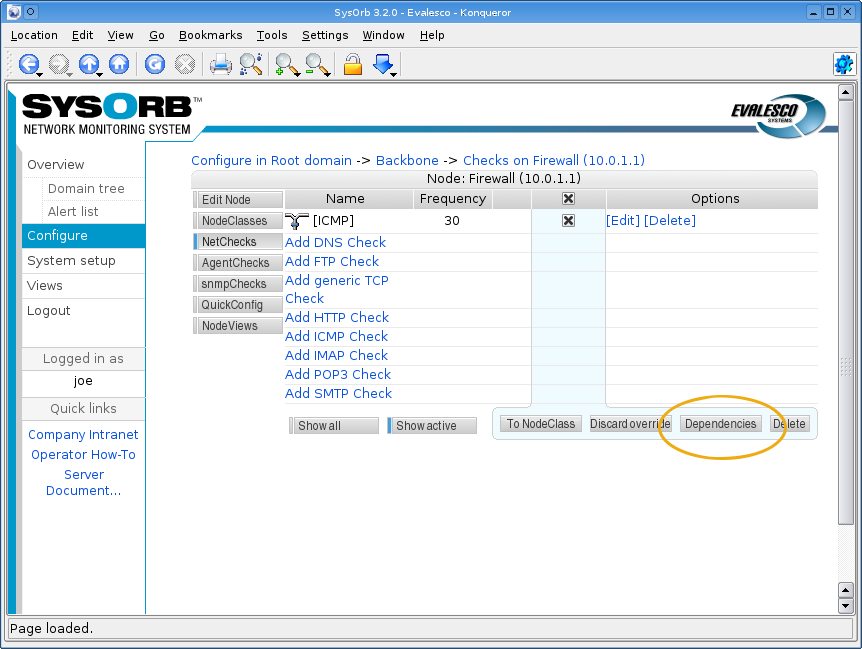
We click the button and are now prompted to select which nodes or checks the firewall ICMP check will depend upon. We could select any domain, node or check in the domain hierarchy - we navigate to the LAN switch and simple select the LAN switch node.
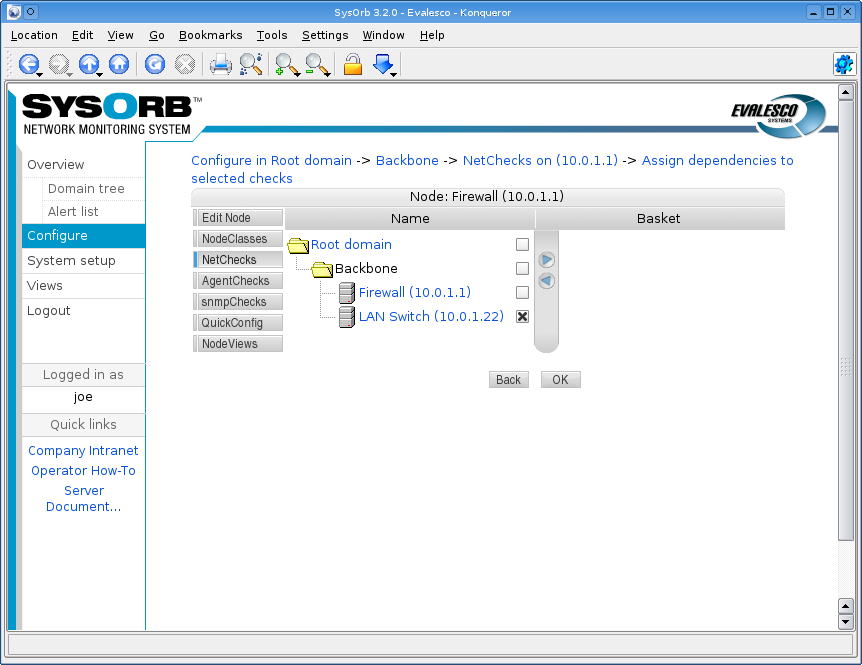
That's it! We have now told SysOrb that if the LAN Switch node fails in any way, then we do not want to receive alerts from the Firewall ICMP check. If, however, the Firewall ICMP check is failing and the LAN Switch is fine, then we will receive alerts from the Firewall ICMP check (as we would expect).
Pulling the plug on the LAN switch will result in both the LAN switch and the Firewall checks failing - but because of the dependency we defined, only the LAN switch will be marked as failing. The Firewall will be marked as "Dependent" - meaning, its status is ignored because it depends on a check which is currently failing.
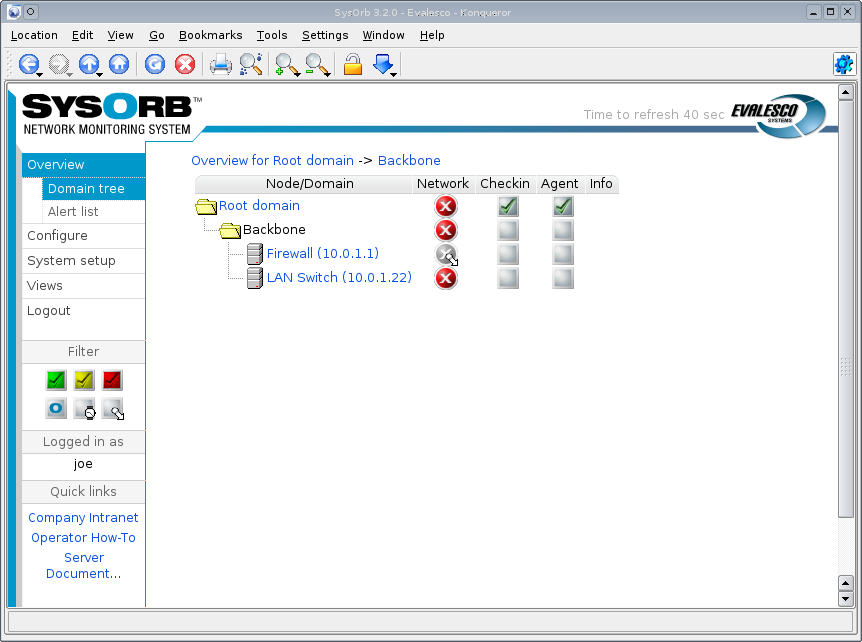
As seen on the screen shot above, when we unplug the LAN switch, the ICMP check on that switch fails. And the ICMP check on the firewall (which is now unreachable because the entire LAN is down), is also failing. But the firewall ICMP check is marked with a different icon; a greyed out icon with an arrow that tells us this check is depending on another check. Alerts will thus not be sent from the firewall ICMP check, only from the switch ICMP check.
4.5.4. NodeClass dependencies
Dependencies can be used in conjunction with NodeClasses as well - for a thorough description of the NodeClass concept, please see Section 4.6.
If, for example, we wish to make all ICMP checks depend on the LAN switch from the previous example, we could choose to configure the dependency on the ICMP check NodeClass rather than on each individual ICMP check. In order for this dependency to work, the ICMP checks must of course be configured via the NodeClass, rather than set up independently.
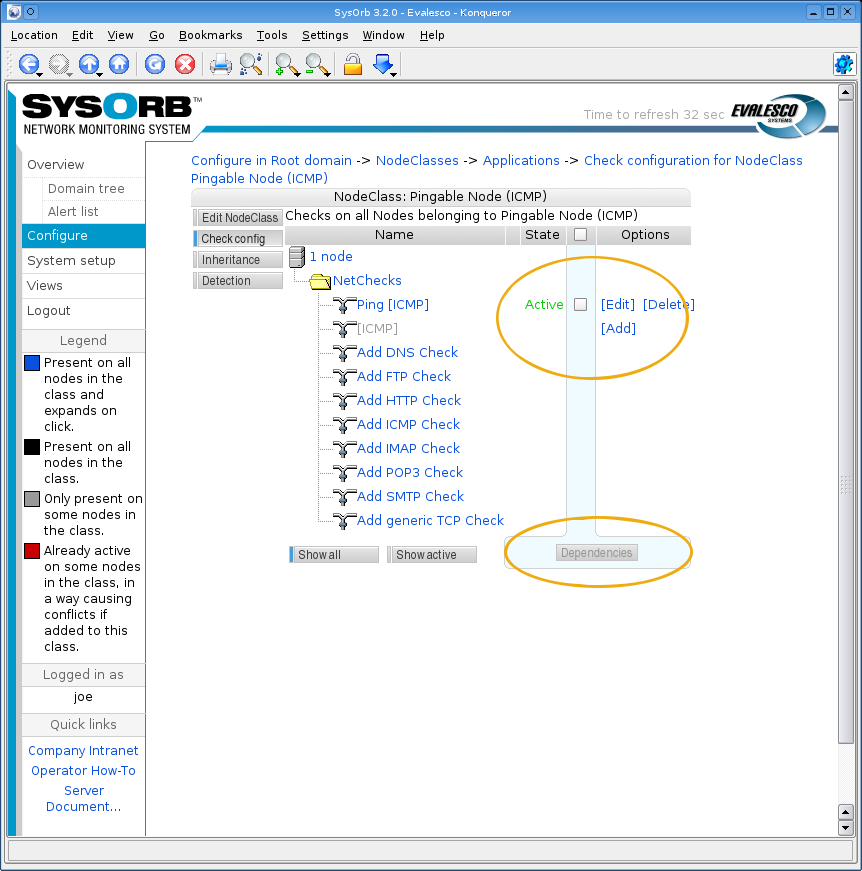
To configure a dependency on a NodeClass check, locate the check under the relevant NodeClass. Now, one can again select the check by marking the check-box, and click the button at the bottom of the screen. From there on, the dependency configuration is identical to the previous example.
4.6. NodeClasses
SysOrb allows you to group nodes across domains. The groups are called NodeClasses. A node may belong to multiple NodeClasses.
Belonging to a NodeClass may have various implications for a Node. It may associate a descriptive icon to the Node, e.g. all Nodes belonging to the "Microsoft Windows" NodeClass will have the familiar icon. It may also imply a number of Checks automatically being set up on the Node. This is the most powerful use of NodeClasses, it allows one to only have to set up the required checks once for each group of identical Nodes, and to easily modify the configuration afterwards.
SysOrb comes with a number of pre-defined NodeClasses, that you can use as you see fit. You can define more NodeClasses yourself, and you can even modify or delete the pre-defined NodeClasses if you like. Mind however, that the pre-defined NodeClasses contain carefully crafted detection rules, which allow SysOrb to automatically put new or existing nodes into appropriate classes.
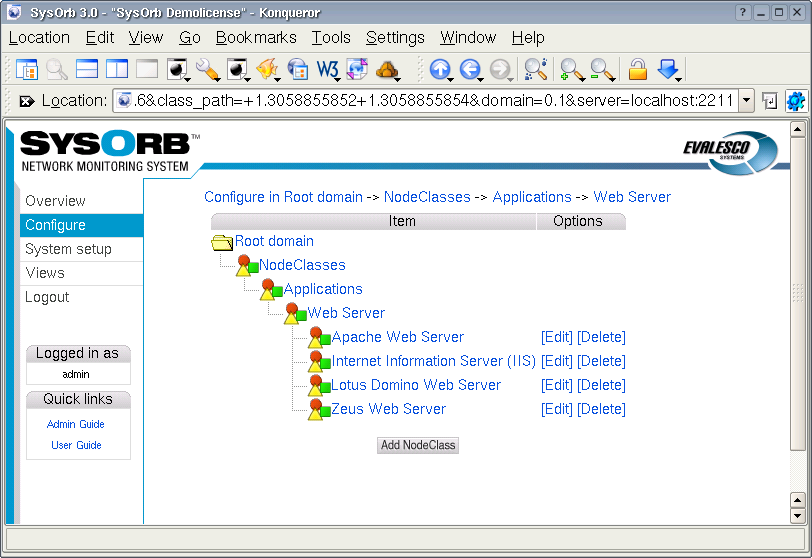
4.6.1. Sub-classes (inheritance)
The pre-defined NodeClass "Web Server" is supposed to contain all nodes running a web server of any sort. Another NodeClass is "Apache Web Server" which should contain all nodes running that particular application. Of course, any node belonging to "Apache Web Server" should also belong to "Web Server".
This relationship between the NodeClasses is declared by making "Apache Web Server" a sub-class of "Web Server", we equivalently say that "Apache Web Server" inherits from "Web Server", and that "Web Server" is a base class to "Apache Web Server". It means that any Node belonging to the "Apache Web Server" class implicitly also belongs to the "Web Server" class (and any classes from which "Web Server" inherits.) This will cause any Check templates in the "Web Server" class to be inherited to the "Apache Web Server" class, and thus apply to nodes belonging to the "Apache Web Server" class. The "Apache Web Server" class can add more check templates and/or override some of the generic web server checks.
4.6.2. Associating NodeClasses to a Node
To set the NodeClasses to which a node belongs follow these steps:
-
Select to the left in order to goto configure mode.
-
In the tree that appears, browse the domain hierarchy to find the Node in question, and click next to it.
-
Click (right below the button.)
-
You should now be able to browse all avaiable NodeClasses to the left, while checking the wanted NodeClasses and selecting them by clicking the right-arrow in the vertical bar.
-
When you have selected all the NodeClasses you want, click .
Immediately after assigning the Node to some NodeClasses, SysOrb will check to see if the NodeClasses define any check templates, and in case they do, apply them to the Node.
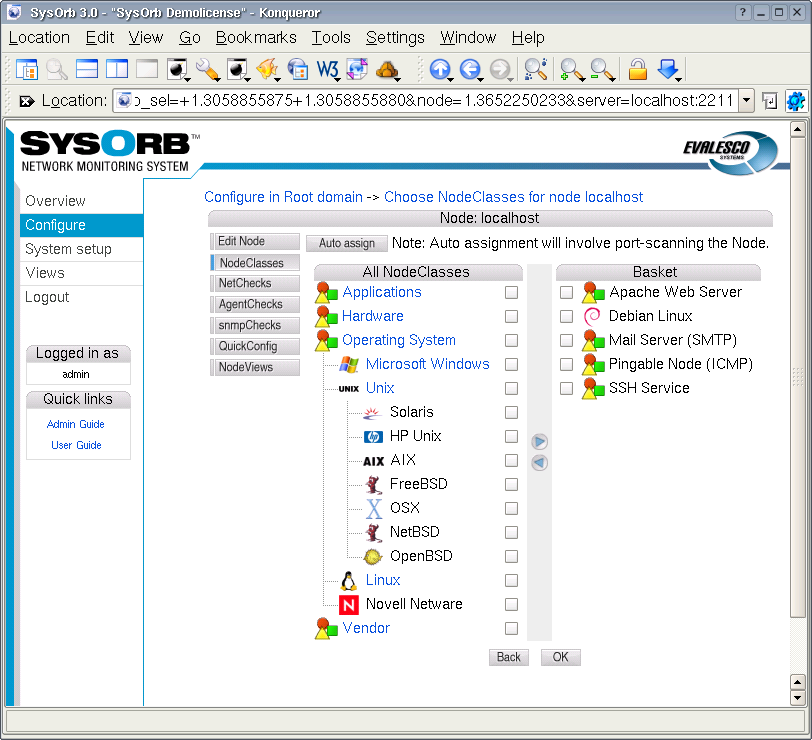
Caution: Should you ever dis-associate a node from a NodeClass wich have check templates, then the checks will immediately be deleted from the node. Setting all of them up again requires no more effort than associating with the NodeClass again, but the historical data will be lost. That means you should be careful when changing the set of NodeClasses to which a node belongs, once checks are set up and have been so for a while.
4.6.3. Creating / Editing NodeClasses
To add your own NodeClasses, or edit/delete existing ones, click and go to the root domain (or a subdomain, if you want your new class to only be visible within that domain and its subdomains.) Then click on the item named NodeClasses, to expand it and see the root NodeClasses.
If your new NodeClass is completely unrelated to the existing classes, e.g. you want to make NodeClasses "1st floor", "2nd. floor", etc. to track the physical location of the Nodes. Then you probably want to create a new root NodeClass called "Floors". You do that by clicking while viewing the root NodeClasses, and filling out the form. You should check the field Abstract for a root class like "Floors". That will prohibit nodes from belonging to "Floors" directly, allowing the nodes to belong to sub-classes of "Floors" only.
Probably most of the time your new NodeClasses will belong somewhere in the existing class hierarchy. If you for instance would make NodeClasses for various releases of your operating system, then these classes should be sub-classes of the existing NodeClass for (any release of) that operating system. To create on of these these, you should browse the NodeClass hierarchy finding for instance the "FreeBSD" class, and clicking to create an "FreeBSD 4.3" sub-class.
When creating or editing a NodeClass, your can fill in the following fields:
-
Name: A short name of the NodeClass. This name will be shown in connection with any node belonging to the class, so please select a name that properly describes a node belonging to this NodeClass.
-
Abstract: If you check this field, then no nodes will be allowed to belong to this class directly, (they can still belong to this class indirectly, by belonging to a non-abstract sub-class of this NodeClass.) This field is set for the predifined classes "Operating Systems", "Applications" and more, as it makes no sense for a node to belong to "Operating Systems", but it makes perfect sense for a node to belong to the sub-class "Microsoft Windows".
-
Information URL: Here you may provide an URL link to some resource relevant for nodes belonging to this class. This link will be accesible from the Node Info subpage of any node belonging to this class.
-
Description: This field is for an description of which nodes should belong to this class.
-
Auto-promote: This field has effect when SysOrb is assigning NodeClasses to nodes during auto-discovery. If SysOrb determines that a node should belong to the base classes of this one (the classes from which this one inherits), and this class is marked auto-promote, then SysOrb will "promote" the node into belonging to this NodeClass. This feature may seem odd, but it is very useful if you for instance want slightly different web server classes for each SysOrb domain, (e.g. on for IntraWeb servers and one for internet accesible web server.) Both are detected by the fact that they respond on port 80, but they reside in the "Internal" and "Internet" domains respectively. By creating two new NodeClasses one in the "Internal" domain and one in the "Internet" domain, both inheriting from the standard web-server class, and both having auto-promote enabled, SysOrb will automatically assign the right class during auto-discovery, depending on in which SysOrb domain the auto-discovery is performed.
-
PNG Icon: If you want all nodes belonging to this class to have a common icon, then you can optionally upload a 24x24 pixel PNG image here. SysOrb does not accept gif, jpg, ico, or any other image format besides png. If your image processor does not support the png image format, then you may visit http://www.libpng.org/pub/png/ for a list of tools to create png images.
4.6.4. Check templates
This is the most powerful feature of NodeClasses. You are able to specify that all nodes belonging to a particular NodeClass should have a number of checks automatically set up. This is not a one time duplication, like the node copying feature which is also available in SysOrb. Instead checks on all nodes belonging to a NodeClass is continually kept up-to-date with the check templates from the NodeClass.
Even though a node has checks set up according to some check templates from a NodeClass, you are still able to manually configure more checks on that node. If you later modify the NodeClass template checks, then these modifications will be propagated to the appropriate checks, leaving the manually configured checks untouched.
If a node is member of multiple NodeClasses, it will receive the union of all checks configured in the NodeClasses. E.g. you have an "Apache web server" class with a template HTTP check and a "Postfix mail server" class with a template SMTP check, then one server which runs both of the applications will naturally belong to both NodeClasses, and automatically have both the HTTP and the SMTP check configured.
Before you can set up check templates for a NodeClass, you must have at least on node belonging to the NodeClass. Preferably you should have associated all of the intended nodes to the NodeClass, before configuring check templates, as that will allow SysOrb to compose the complete set of available checks for the affected nodes.
You configure check templates by clicking Edit next to a NodeClass, and selecting in the menu.
Then you will be presented with a tree containing all NetChecks, SnmpCheck and AgentChecks available on any of the nodes belonging to the NodeClass. You may browse the tree and configure any of the checks, just as if you were configuring checks for a single node. These configurations will have immediate effect on all nodes belonging to the NodeClass.
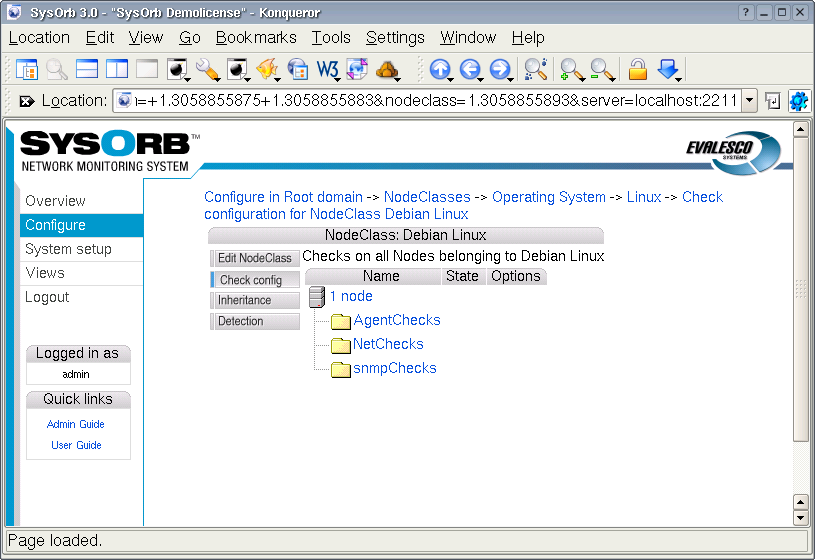
Some checks come in a group of similar checks. E.g. the filesystem free space AgentChecks or the SnmpChecks in the group ifTable. With NodeClasses you can configure all checks in such a group at once. This beats the QuickConfig feature in the way that it is not a one time duplication, but checks on the node are continually kept up-to-date with the check templates from the NodeClass. If the node is later re-scanned, and more checks appear in the group (e.g. an extra disk driver or new switch ports,) then these checks are instantly set up according to the NodeClass templates.
You configure all checks in a group by browsing into the "All entries" folder, which appear at the very bottom of groups like "FS free space" and "ifTable".
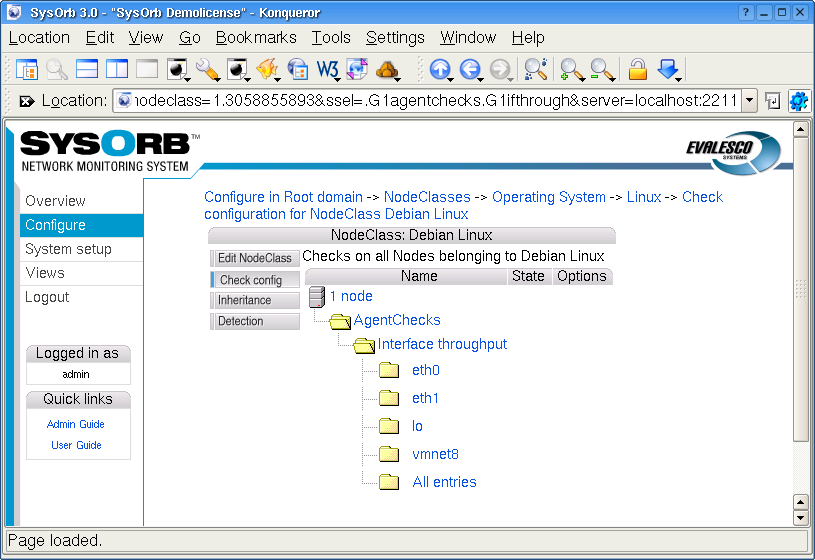
4.6.4.1. LogChecks and NodeClasses
You may want multiple NodeClasses to contribute with rules to the same LogCheck. The most obvious example is the windows Event Log. The "IIS" NodeClass, the "Exchange" NodeClass, the "Print Server" NodeClass, and the "Windows" NodeClass itself all would like to add some rules to the Event Log check.
If you simply configure a check template for an Event Log LogCheck in all of the NodeClasses, then you get a NodeClass configuration conflict. Just as if you configure any other check like (e.g. CPU Idle time) in multiple NodeClasses, and a node happen to belong to more than on of these NodeClasses. SysOrb simply does not know from which NodeClass it should take the configuration.
To work around this limitation, you should use parasitic Forward LogChecks. Parasitic LogChecks works by "stealing" the log entries from a host LogCheck. I.e. each time an entry arrives to the host LogCheck, the entry is first run through all the rules of the parasite LogCheck, only if none of these rules match will the entry run through the rules of the host LogCheck.
Back to the Event Log example. The recommended way to set up the NodeClasses in that case, is to configure the Event Log check itself in the "Windows" NodeClass (and only in the "Windows" NodeClass.) The other NodeClasses, which wants additional rules put into the Event Log check, should do so by means of a parasitic Forward LogCheck on the Event Log check.
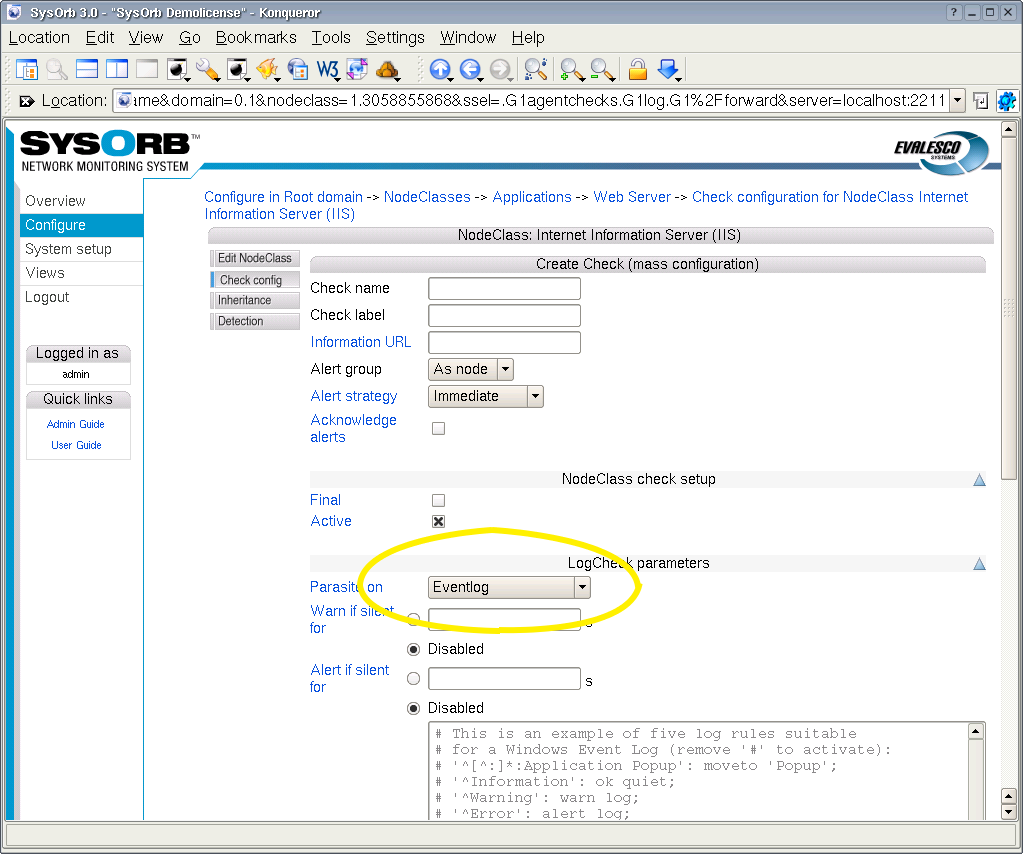
4.6.5. Detection rules
During auto-discovery (see Chapter 5) SysOrb is able to automatically assign the newfound nodes to appropriate NodeClasses. To enable this, each NodeClass may have a number of detection rules, which basically states, that if the node behaves in a certain way during auto-discovery, then it should belong to this NodeClass.
There are a number of detection rule types:
-
Can connect to port: With this rule type, you specify a port number, and the rule matches if the node responds to TCP requests on that port. Example: If you are creating a NodeClass "Microsoft SQL Server", then you can make a rule stating that any node responding on TCP port 1433 should belong to this class. (As 1433 is the port used by the Microsoft SQL server.)
-
SMTP / POP3 / IMAP / FTP Greeting: These four types of rules exploits the fact that accoring to the four aforementioned protocols, the server has to send a greeting message, before the connecting client may send the first request. During auto-discovery SysOrb sends no requests, but it still records the greeting sent by the server. This greeting message is matched against the pattern given for the detection rule in the form of POSIX regular expression.
For more information about regular expressions, please consult http://www.opengroup.org/onlinepubs/007908799/xbd/re.html
-
HTTP: This type works just like the above, but matches the pattern again the reply from the server. The requested page is "/" ie. the root page of the server, which most often is "index.html".
-
Is pingable: This type of rule has no parameters, and simply matches if the node responds to ping (ICMP echo) requests.
-
Has DNS service: This type of rule has no parameters, and simply matches if the node responds to DNS requests on UDP port 53.
-
SNMP OID prefix: Every SNMP agent has an number sequence (OID) which identifies the vendor and exact type of the SNMP agent. This number sequence consists of a subsequence identifying the vendor, followed by a subsequence chosen by the vendor to identify the particula model/type of SNMP agent. For instance: an HP ProCurve 4104GL Switch identifies itself by the following OID: 1.3.6.1.4.1.11.2.3.7.11.27 . In this case 1.3.6.1.4.1.11 is allocated to HP, and 2.3.7.11.27 is the sequence chosen by HP to identify the particular ProCurve switch.
When setting up this type of rule, you should enter an OID prefix, which for instance could be 1.3.6.1.4.1.11 . The rule will match if the node responds to SNMP requests, and the OID returned by the SNMP agent on the node starts with the given prefix. That means that any HP device will be matched by the above example prefix.
-
Node info: If an SysOrb Agent has been installed on a node it will send back to the server some information about the Node ie. Node info. You can view this Node info by first viewing the Node and then select the Node info button. The pattern is matched against this Node info. Fx. you can detect a Linux OS by using the following pattern OS.Id.*Linux.
You configure detection rules by clicking Edit next to a NodeClass, and selecting in the menu.
4.6.6. Distributing standard NodeClasses
If you are a systems integrator or consultant dealing with multiple SysOrb installations, then over time you will probably refine your best practice into a set of NodeClasses with detection rules and check configuration templates.
You may want to transfer updated versions of these NodeClasses from your reference system to various SysOrb installations. This can be achieved using the XML export/import utilities mentioned in the SysOrb administrators guide.
You can export all NodeClasses from the root domain of a SysOrb server with the following command:
sysorb-exporter -l admin -I NodeClass+ -f bestpractice.xml
You can later import these NodeClasses into another SysOrb server with the following command, which will overwrite existing nodeclasses with the same name as the ones in the XML file:
sysorb-importer -l admin -f bestpractice.xml
For further instruction on how to use the XML tools, please consult the SysOrb administrators guide.
4.7. NodeViews
Sometimes a specific subset of the NetChecks, AgentChecks and snmpChecks on a node is of particular interest to some people. If a single monitored machine runs both a web server and mail server, it makes sense to put the http response time (NetCheck) along with a log check on the web server error log (AgentCheck) and other check relating to the web service into one group. And put the mail related checks into another group. For these situations SysOrb allows you to group together a subset of the checks on one node, and showing the combined status of these checks on the node overview page with a user specified label.
In SysOrb these subsets are called NodeViews, (the generic Views can contain checks from several nodes, see Chapter 7.) To create a NodeView go to the configuration page for the node and select the tab, then click the button . You will then be prompted for a name for the new NodeView, and you will see a list of all NetChecks, AgentChecks and snmpChecks on the node. From this list you can select the checks which are to be members of the NodeView, a single check may be member of multiple NodeViews. After selecting the wanted checks click .
After creating your first NodeView you can select to the very left in order to see it. You should see the name of the NodeView above the usual node status box. The icon next to the name shows the worst status of any check in the NodeView. By clicking the name you will be able to see the status of all checks belonging to the NodeView.
4.8. MultiCheck graphs
Presenting the results from multiple checks in a single graph can provide insights into how different checks interact or simply provide a more detailed view of the current status on a monitored device or system. MultiChecks provide a way of configuring a view of multiple existing checks in a single graph.
You can add a MultiCheck anywhere where you can have checks; under NetChecks, AgentChecks or SnmpChecks. Simply go to under a node, and select .
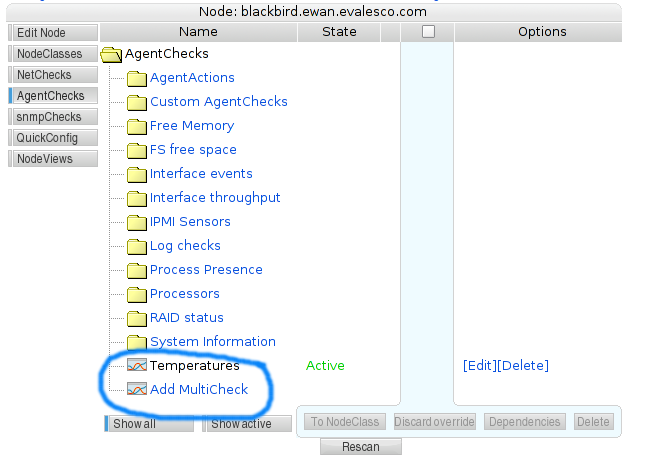
After clicking the button, a name for the MultiCheck must be specified. Pick any short and descriptive name that would fit the MultiCheck you wish to create. In this example, we name it Load response, because we wish to display the response time of the server against the load of the server, to see if the response time is affected noticeably by the load of the server.
Once the empty MultiCheck has been named, it is now possible to add either single series or sums of a set of series to the MultiCheck.
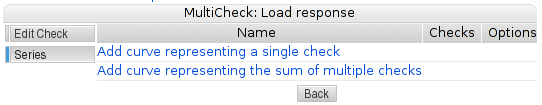
One can add any number of checks to a MultiCheck. However, it is rarely practical to add more than 4-8 checks, because the resulting graphs become increasingly difficult to interpret. Another thing one should consider, is the unit of the included checks. The graph routines in SysOrb will add more axes to the graph to accommodate one unit per axis. If one adds many checks with different units, the graph will become much more difficult to read for most users, as graphs with more than two or three axes are not commonly used elsewhere.
Once the series we want in the MultiCheck have been added, the check configuration should look something like the image below.
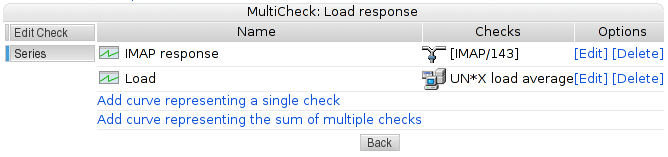
Clicking to the left will take us from mode to mode, and will show us the MultiCheck. Take a look at the example image below, and read on for the explanation of the graph.
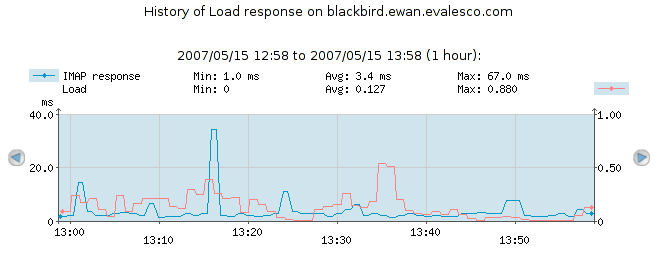
Looking at the right-side and left-side axes, it is also clear why the two checks are associated with each their axis. The left-side axis (response time) represents 0 to 40 ms, while the right-side axis (load) represents a (unit-less) load average from 0 to 1.
The above begs the question; what happens with the axes as we add more series? In that case, SysOrb attempts to do the most sensible thing; it will collect all series which use identical units on the same axis. And it will add axes as needed, to accommodate every unit used. The end result will be a graph with as few axes as possible. In the example below, we have added SMTP response (which is measured in ms just like the IMAP response), and processor temperature (which is measured in Degrees Celsius, which will be the 3rd unit we add to the graph).
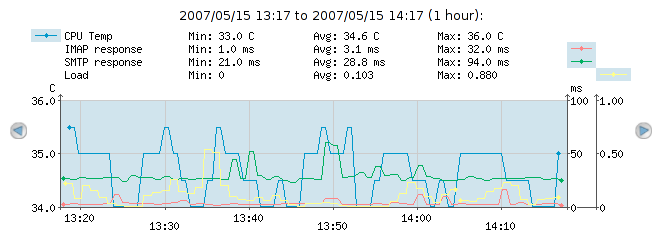
4.9. Moving Nodes between Domains
You can move Nodes into sub-, super- or sibling domains if you like. This will move all configuration and statistical data, and monitoring of the Nodes will be uninterrupted. Moving nodes is solely an administrative operation, used to group Nodes conveniently, or impose Domain-based access control.
-
Select to the left in order to goto configure mode
-
In the tree that appears, choose the domain in which the Nodes are currently located.
-
Click at the bottom of the page
-
In the tree that appears, choose the domain to which you want to move the Nodes. You can browse around by clicking the domain names, and select the domain your want, by clicking the [Select] link to the right of the Domain.
-
Now you may be asked to confirm the move. This only happens if some of the Nodes or Checks contains references to AlertGroups, which is not visible in the Domain to which you are about to move them. If you choose to proceed, these references will be cleared. I.e. the Nodes will have their AlertGroup set to None and Checks will have their AlertGroup set to As Node.
Chapter 5. Auto-discovering nodes on network
In order to quickly setup monitoring on a IP-address range you can use the auto-discovery feature of SysOrb. This will add all newly found nodes to the current domain and enable the checks you have choosen in to scan for.
In order to initiate an auto-discovery, do the following:
-
Select to the left in order to goto configure mode
-
In the tree that appears, choose the domain in which to add the nodes found during the scan, by clicking on the domain name.
-
Select at the bottom of the page
-
You will now see the auto-discovery startup page as shown below:
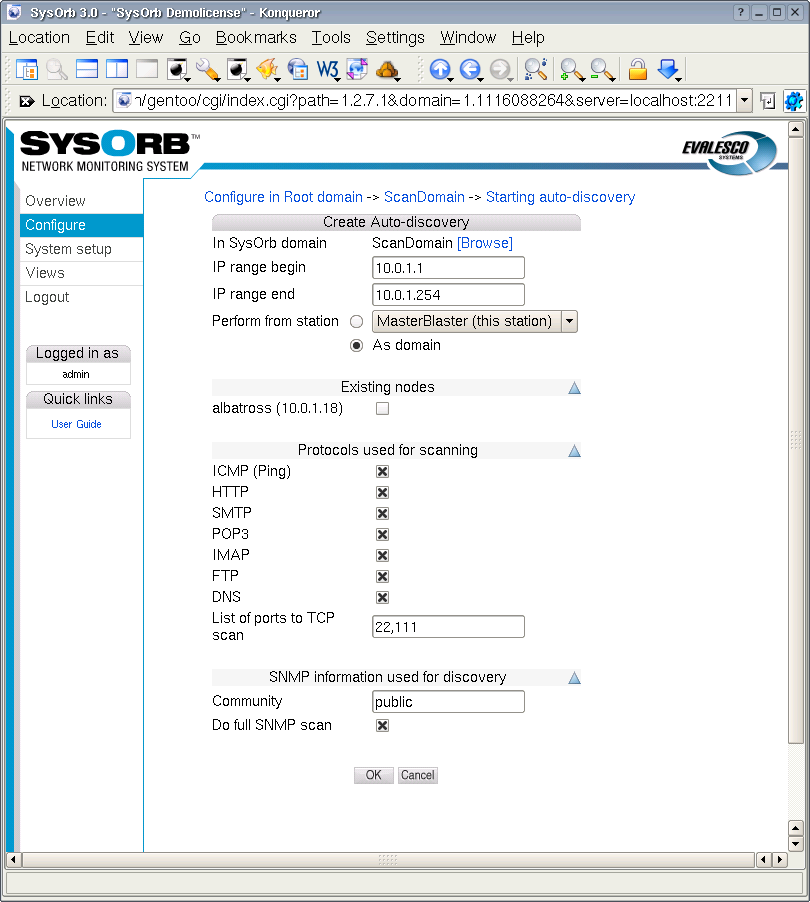
-
Fill in the requested information:
-
In SysOrb domain: This domain is where the newfound Nodes will be created. It also influences which NodeClasses is considered, when SysOrb is automatically assigning classes based on the services provided by each node. Basically SysOrb only considers NodeClasses belonging to the selected domain, or one of its ancestors up to the root domain.
-
IP range: If you want to find machines not yet created in SysOrb, then you should give an IP range for SysOrb to scan. Both endpoints are included in the scan.
Default value: 254 IP addresses around the address of the SysOrb server
-
Existing nodes: If you want to automatically set up NetChecks and NodeClasses on some Nodes already created in SysOrb, then you can check them here. Note that you cannot both enter an IP range and some existing nodes, if you want to do both, you must start two separate auto-discoveries.
-
Protocols used for scanning: SysOrb will discover nodes by trying to contact each IP address in the given range on each of the protocols selected in this field. If a node responds to one of these protocols, the node will be created in the domain, and a NetCheck will be configured and activated on the node.
-
SNMP Community: Nodes running a SNMP Agent will typically provide information about their brand and model, this can be used to automatically assign the nodes to very specific NodeClasses. In order for the SNMP Agent to reply to SysOrb's requests for information, SysOrb must know the (read only) community of the SNMP agent, which you can enter here. If you leave this field blank, no SNMP detection will take place.
Default value: public
-
-
Click the button to start the auto-discovery.
You wil now see a page showing the setup and progress of the scan. You can at any time select to do other things, the scan will continue to run in the background until done. In order to check the progress again just click the auto-discovery icon that has appeared in the domain you created the scan. Make sure to be in configuration mode by selecting on the left.
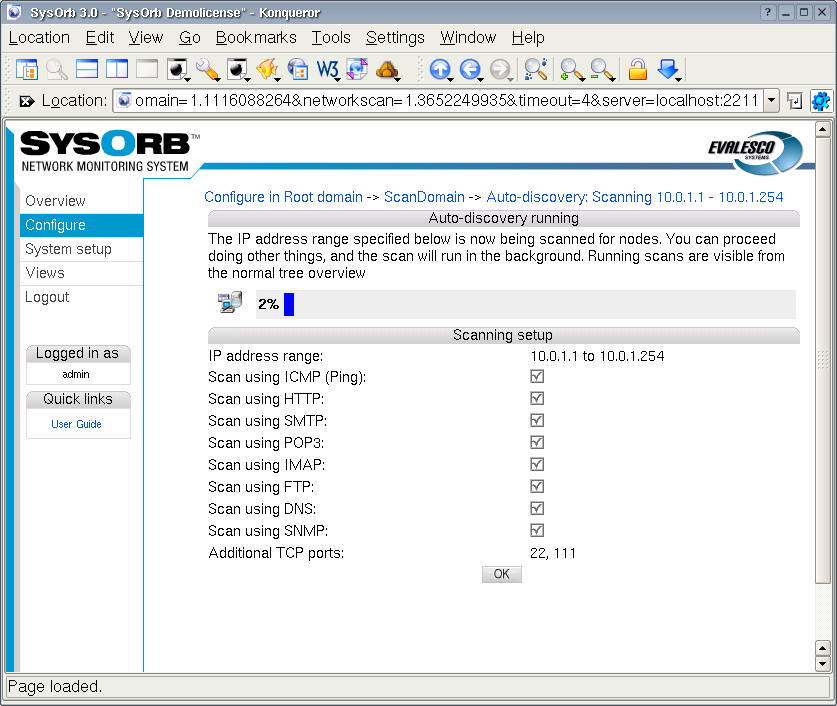
Chapter 6. Report generation
You can make SysOrb generate a report about the condition of your network during a specified time interval. This chapter will guide you through setting up a report template, and generating the report.
6.1. Creating a report template
A report template is used to define which parts of the monitored Checks/Nodes/Domains you want to include in the report. Typically you will have a few report templates, and have SysOrb generate instances of these templates either by explicitly requesting them, or automatically at regular time intervals. Older instances will be available for reference and comparison.
To create a report template choose Configure in the navigation menu, and do the following steps:
6.1.1. Step 1: report type
-
In the tree that appears, choose the domain you which to generate a report for by clicking on the name.
-
Click the button.
-
Give the report a name in the Report name field.
-
Choose the report type. You can select one of the following:
-
System availability: Reports any severe events and calculates a availability percentages, downtime percentage etc. for a all Checks/Nodes and Domains. It will also make plots of the checks for the period.
-
Severe events: Reports any severe events in the period choosen.
-
Response time: Reports the response time of the checks in the period choosen.
-
Current licenses: Reports number of licenses currenly assigned to each of the domains configured.
-
-
Next select the period in time you wish to make the the report for. You can eighter choose a period e.g. Last week, and when the report is generated it will make the the report for the time interval: sunday 2 weeks ago until last sunday.
You can also specify a time interval to make the report over. This is mostly used to generate a report once, whereas using a period is used if you would like to generate a report every week for example.
-
In the section Recurrence you can specify that SysOrb should automatically generate an instance of this report template a some given points in time.
-
In the field Email addresses you can specify a comma separated list of email adresses of people who should receive a copy of the report every time an instance is generated. This is particularly useful in conjunction with recurrence (above).
-
Max. instances when set will limit the number of instances of this report template, that SysOrb will store. If the limit has been reached SysOrb will delete the oldest instance, when a new report is to be generated.
-
Last select the Public visible if you want other people that yourself to see reports generated by this template
-
Click the button to go on and select which nodes should be included in this report.
6.1.2. Step 2: Node selection
Now you should select the Domains/Nodes to be included in the report. Selecting a domain means that every Node in that domain and its subdomains will be included in the report.
You can see the current selection in the right half of the screen. You add or remove Nodes or Domains from the selection by checking them and pushing one of the arrow buttons in the center bar.
If you want to include nodes primarily based on their NodeClass, then select the topmost domain here, and you will be able to constrain the nodes to be included by their NodeClass in the next step.
When you have made your selection, push the button at the bottom.
6.1.3. Step 3: NodeClass selection
If you do not select any NodeClasses at this step, then every Node selected in the previous step will be included in the report.
If you select some NodeClasses here, then only nodes which belong to every one of the selected NodeClasses will be included in the report. If you for instance select the classes "Web server" and "Debian Linux", then only Debian machines running a web server will be included. If you select "Windows" and "Solaris" then no Nodes will be included (as no node can belong to both the "Windows" and the "Solaris" NodeClass.)
If you want all of your Windows server and all of your Solaris servers in one report, then select one of the classes at this time. And after Step 4 go back and make an additional selection with the other NodeClass.
When you have made your selection, push the button at the bottom.
6.1.4. Step 4: Check selection
If you want all checks on the selected Nodes to appear in the report, then you can skip this step. Otherwise you can select among all the checks present at any of the included nodes. If some of the nodes does not have all the selected checks, only the ones which is actually active on the particular node will be shown in the report. (Other nodes in the report may still have all the checks shown, if they are present there.)
When you have made your selection, push the button at the bottom.
6.1.5. Finalization
You have now completed the report template, and may proceed to generate a report instance from this template.
Optionally you may go back and add more selections, this will take you through steps 2 to 4 again.
6.2. Generating the report from the template
Now that you have made a report template you are ready to generate the report. Select the in the navigation menu, and do the following steps:
-
In the bottom of the overview tree you can see your report template name. Click on it.
-
You can now click the link Generate to generate the report.
-
When the report generation is finished ie. the progress bar disappears and Generate reappears, you can see your reports in the list of generated reports for this template. Every time you generate a report for this template it will be appended to this list.
You can now view or delete the generated report as you like.
6.3. Reading the generated reports
The content of every SysOrb report is structured the same way as your domain heirarchy. I.e. each domain is represented by a section in the report, with subdomains represented by subsections. When browsing through the report you may expand or collapse each section, or you can choose the printable format in which every section are expanded.
When calculating the availablity percentages for a given check, SysOrb does the following: For each point in time within the interval for which this report is to be generated, the check fall into exactly one of the following three cases:
- Confimed downtime
-
SysOrb has statistical data indicating that SysOrb performed the check, but failed to get a reply. Or that the reply was outside the configured alarm thresholds. In short, this is the periods in which a red icon has appeared for this check.
- Confirmed uptime
-
SysOrb has statistical data indicating the the check was performed, and returned a reply which was inside the alarm thresholds (but may have been outside the warning thresholds.) In short, this is the periods in which a green or yellow icon has appeared for this check.
- Unconfirmed uptime
-
SysOrb has no statistical data for the period. This may be caused by the SysOrb server or agent having been down for a period, or that the check was simply not configured at that time.
The availability percentage for a single check, visible at the very top of the section describing a check, is simply the sum of "Confimed uptime" and "Unconfirmed uptime". In adding these numbers SysOrb makes the optimistic assumtion, that even though the SysOrb server is down for a period of time, everything else keeps running.
The total availability of a node is calculated as the average of the availabilities of every one of its checks, which are included in the report. The total availability of a domain is likewise calculted as the average of the availabilities of every node in the domain (including subdomains), which are included in the report.
Chapter 7. Views
SysOrb graphical view is a unique function that enables the user to easily upload a png image to the SysOrb server. Typically the image would be a geographical map or a typology map of the network. Once an image has been uploaded, the user can chose to ad nodes, checks or domains to the image/map. For example this feature can be used to:
-
Create network maps with a status icon for each device on the map.
-
Create "Map" views that can be shown on network operation center screens.
-
Create a network overview for publishing on the companys Intranet for e.g. information to the top management.
-
Create a custom view of the most important nodes/checks in your network.
7.1. Adding a new view
To add a new new view, do the following:
-
Select in the navigation menu to the left.
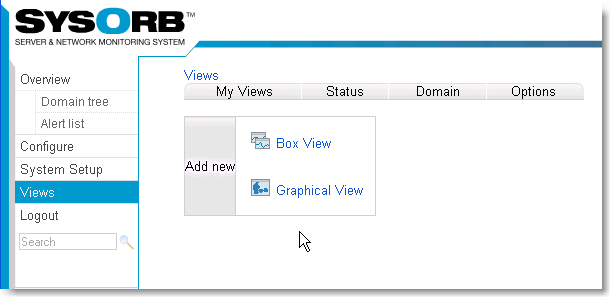
-
Click the , to create a new view. You will now get a view template you can fill out.
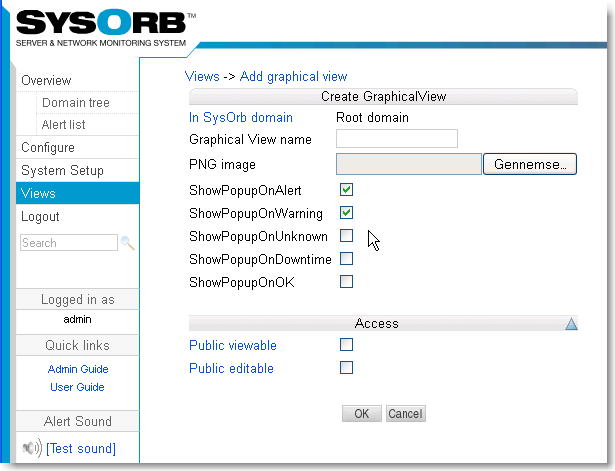
-
Enter the name you want the new view to have.
-
Select the PNG image you would like to upload to SysOrb.
-
You chose if you would like a popup on alert or not. A Popup is a small box that will appear every time there is an alert. You can always edit this later.
-
Select the Public view button, if you want other users to be able to use this view.
-
Select the Public view button, if you want other users to be able to use this view
-
Finally press the button to accept the new view.
After adding a new view you would probably like to edit it, selecting the checks, nodes and domains you want to view.
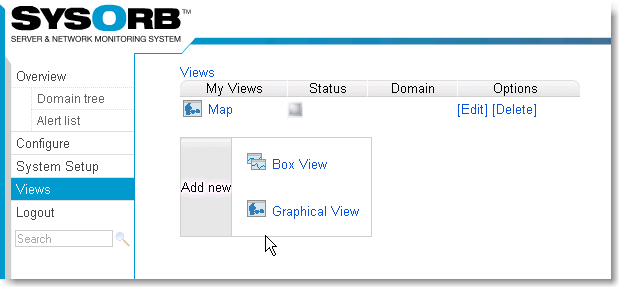
-
Press Edit to configure your map.
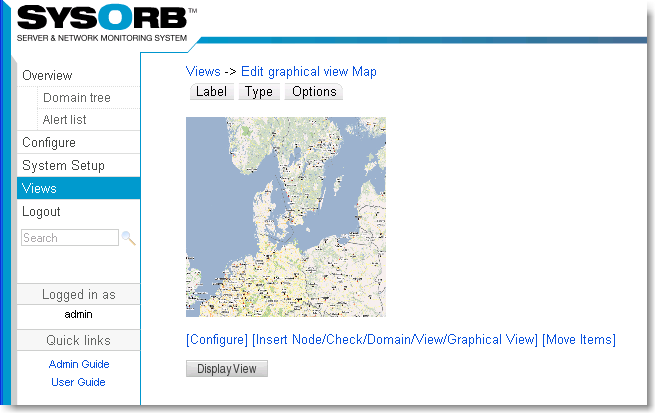
-
Press (Insert Node/Check/Domain/View/Graphical View).
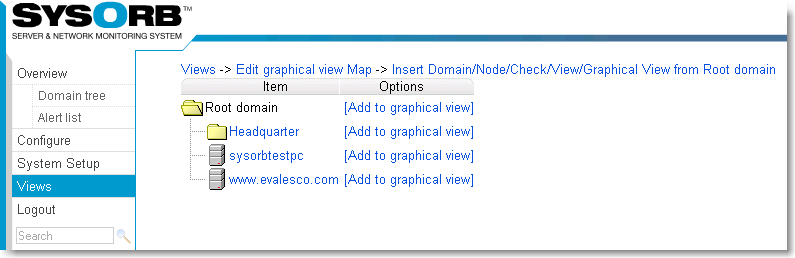
-
Navigate to the check, node or domain you want to place on your graphical map. And click the Add to graphical view link..
-
In this example we will chose sysorbtestpc
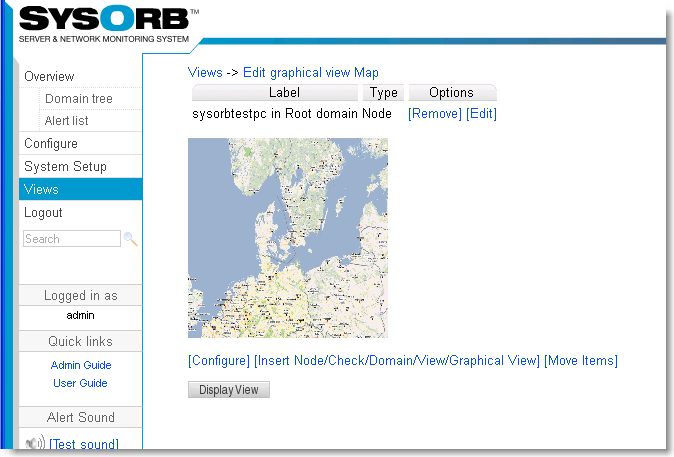
-
Now we can chose to give sysorbtestpc a new label or we can chose to have no name at all for the node. We chose edit to change the label.
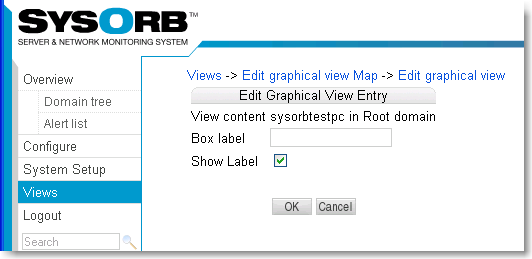
-
If no box label has been set the default will be the node name. Now we change the name to e.g. serv1 and press OK.
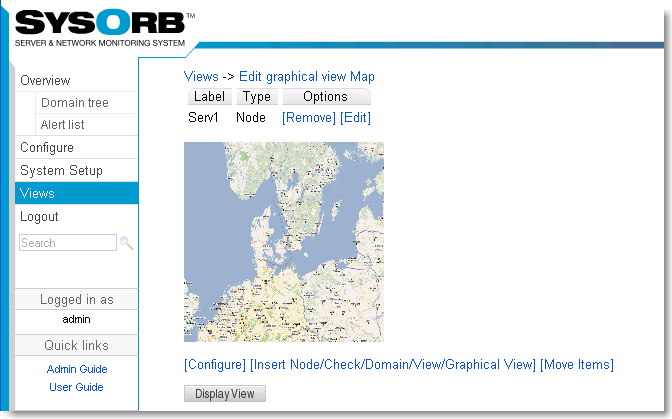
-
In order to move the node to where it should be on the grafhical view press (Move Items).
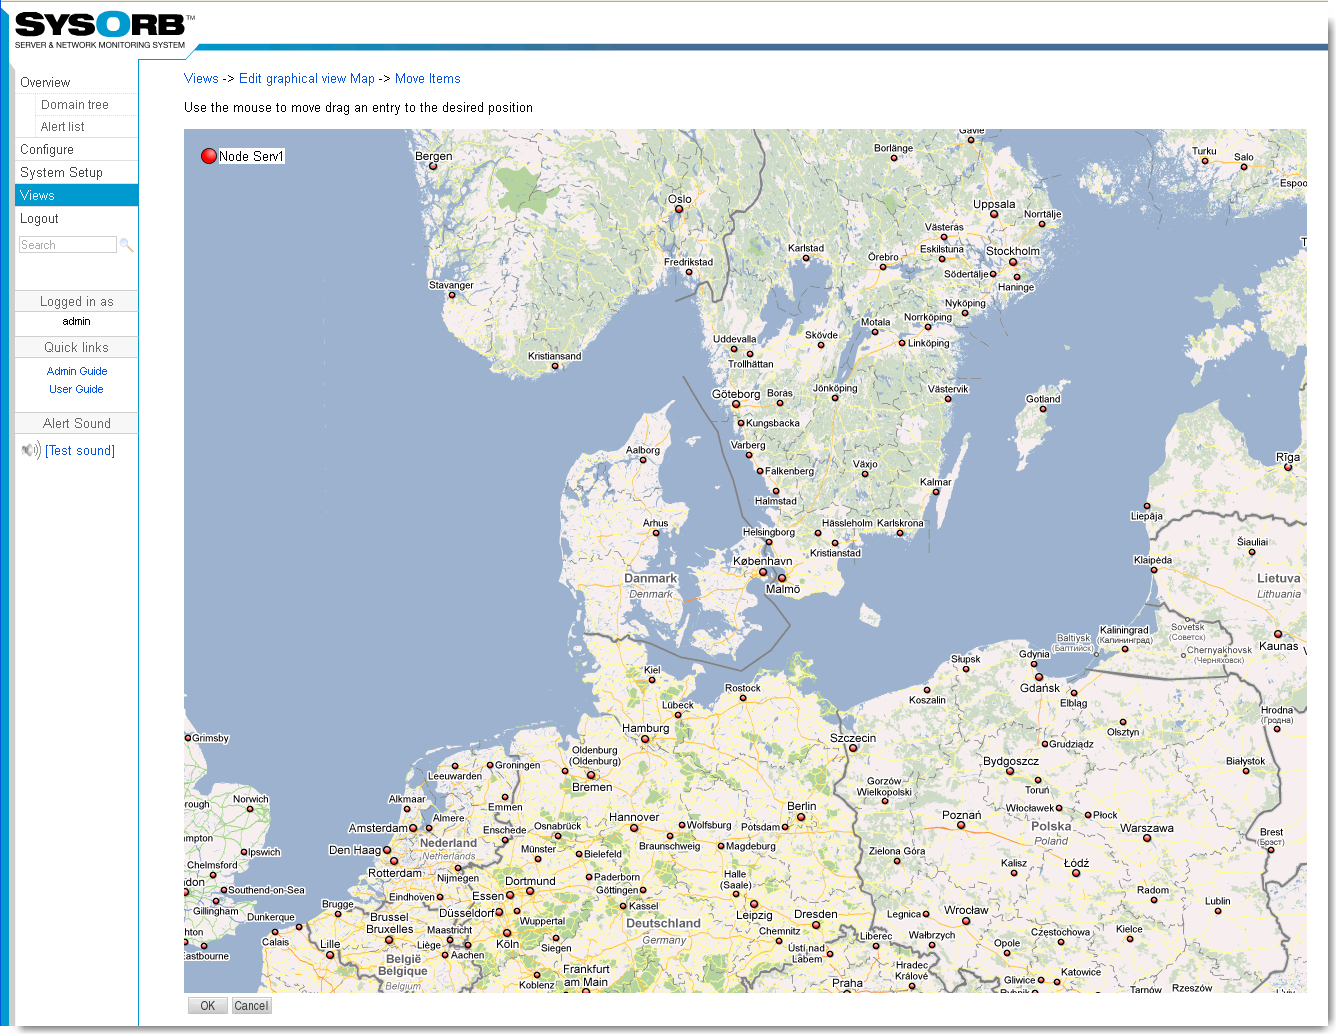
-
Using the mouse you should now be able to move the node around and place the node exactly where you would like it to be on the map. Once you placed the node where it should be press OK.
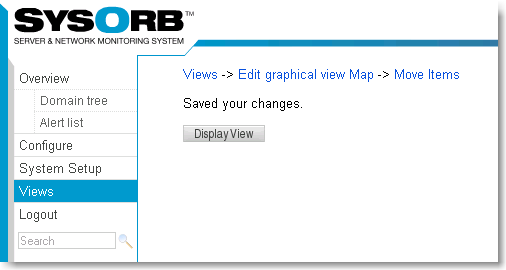
-
Press display view to see the result
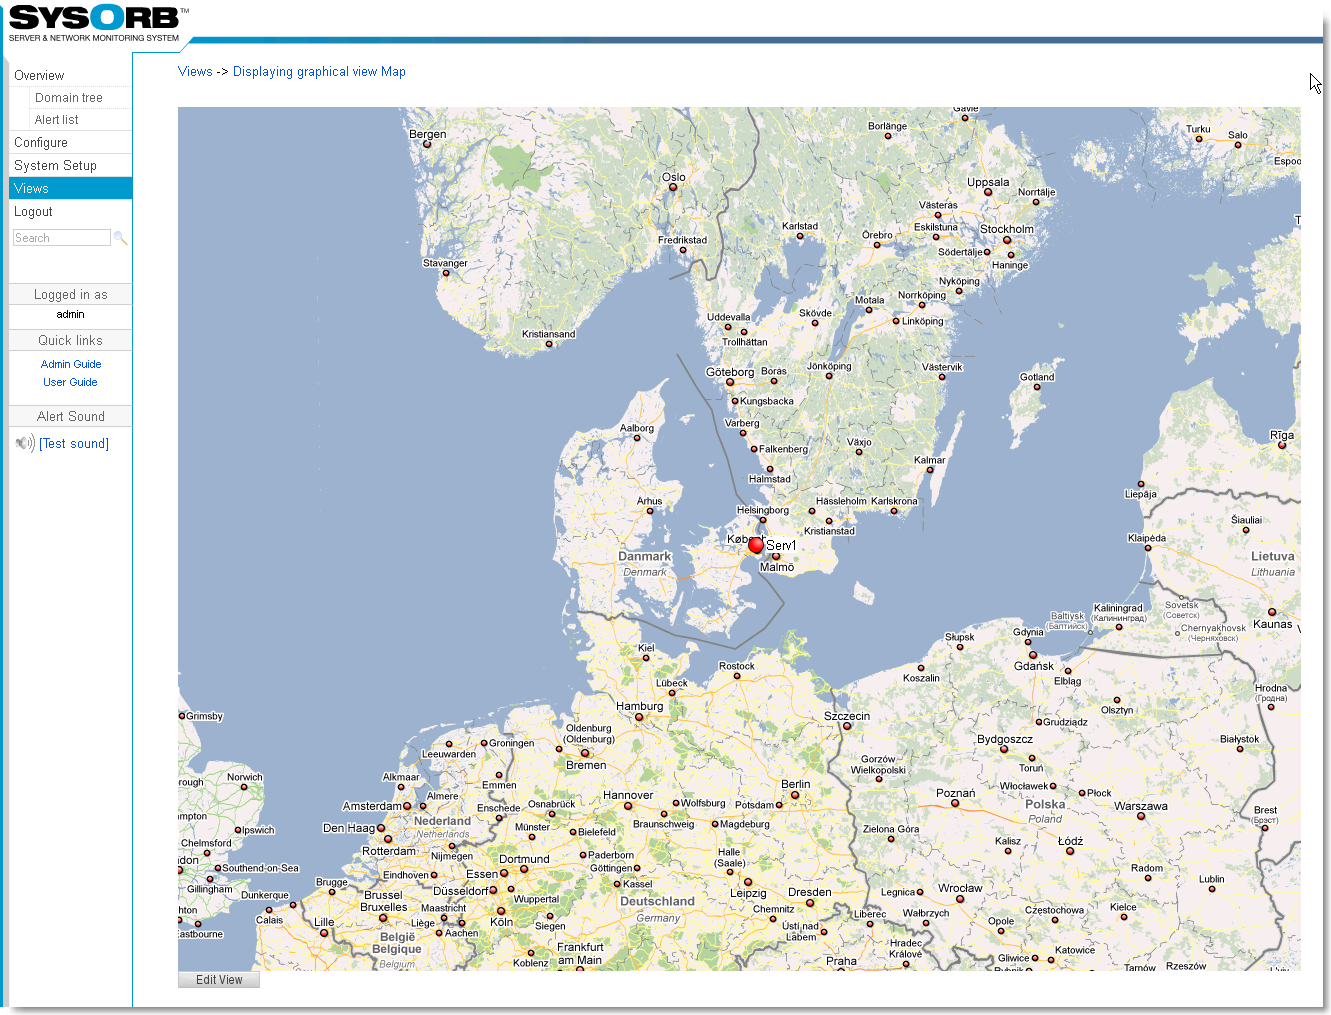
As we configured earlier that we would like a popup on alert we see it now. The popup tell us the there is an alert on this node. If you press the grey area in the popup you can navigate directly to the node to see what the problem is.
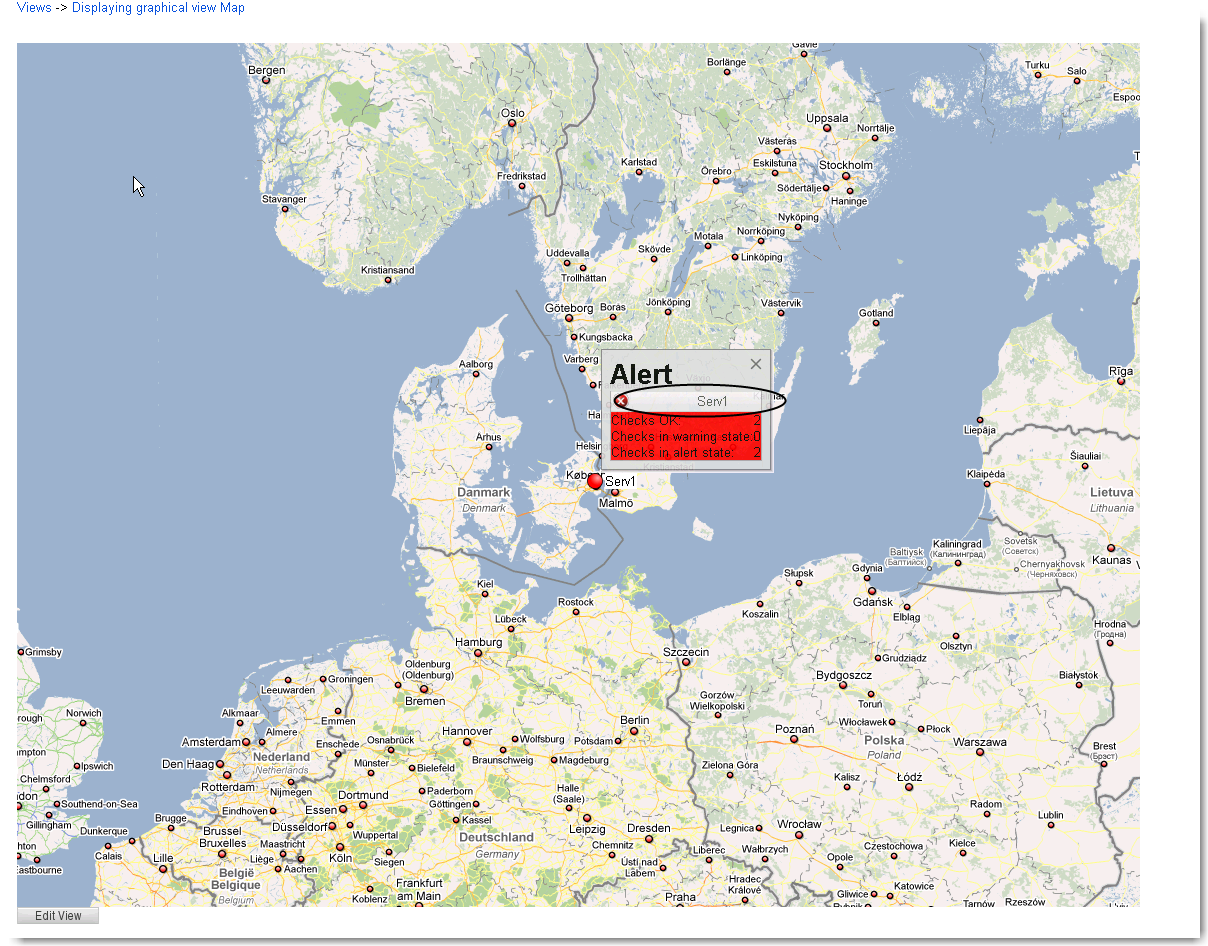
7.2. Edit a view
To select which checks, nodes or domains you want in a view you have to edit it. Furthermore, you reconfigure the layout of the view by editing it.
To edit a view, do the following:
-
Select in the navigation menu to the left.
-
Click edit on the view you want to change. You will now see some boxes in your browser window, all containing the text link . The idea is that each box can contain either a check, a node or a domain.
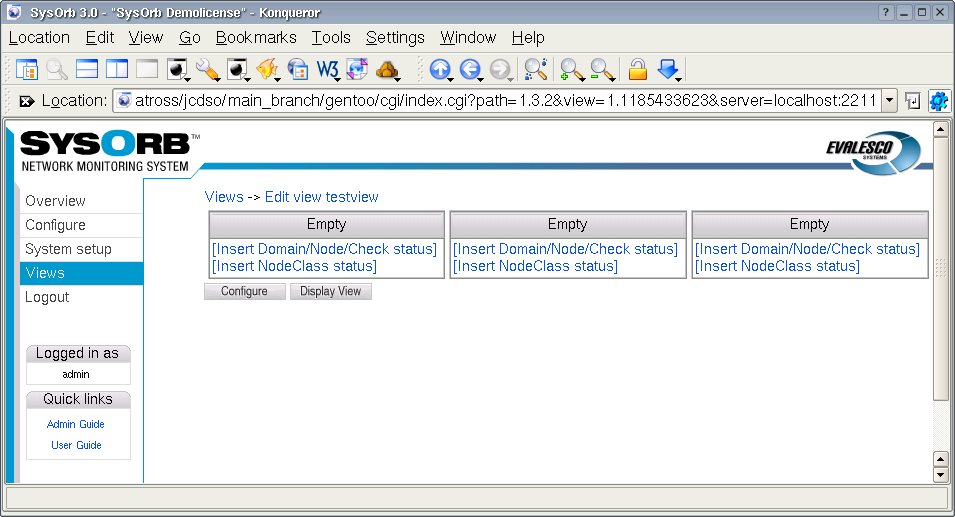
-
Click one of the links. You will now see the usual domain tree, like in a overview. But on the left of each entry in the tree, there is a link. When you click on such a link, the associated check, node or domain will be put in the view box.
-
Navigate to the check, node or domain you want to put in the view box. And click the link.
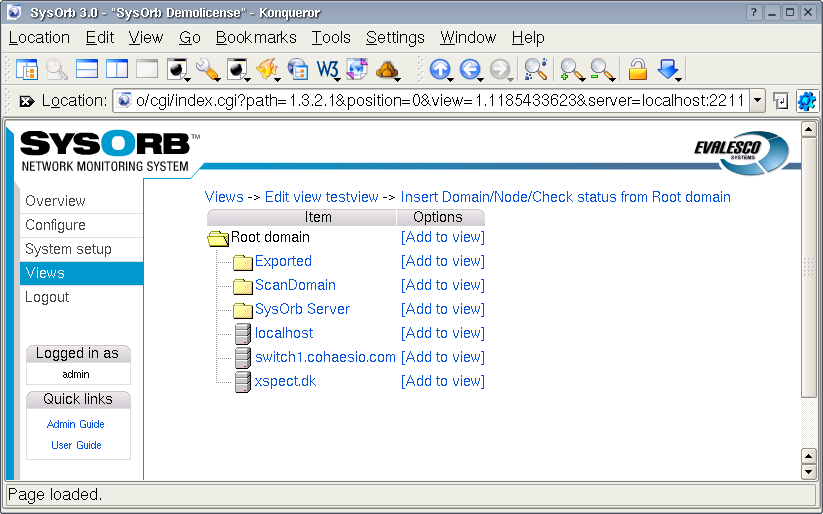
-
You will now get back to the edit view page, where you can see all boxes of the view. As you can see you have probably got a new row of empty boxes in this view. You can see the name of the box you have just created appear in the title row of the box.
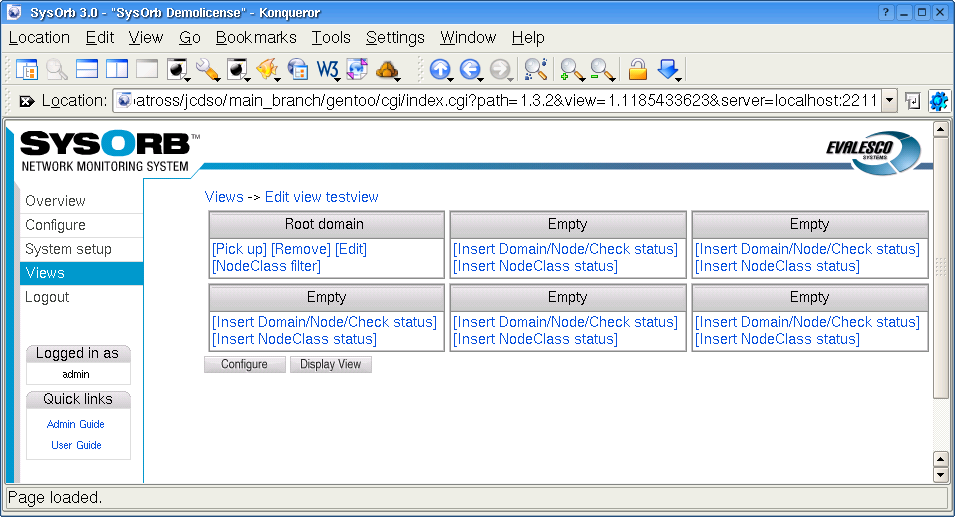
-
Add more boxes is you see fit.
-
During the process you can change to , in order to see how the view looks.
-
When you are done you can use your view as described in Section 7.4.
7.3. Reconfiguring layout of a view.
If you discover that the initial properties (ie. layout) you assigned your view at creation time isn't appropriate, you have the ability to change these.
To change view properties, do the following:
-
Select in the navigation menu to the left.
-
Click edit on the view you want to change.
-
Just below the boxes you will find a link. Click on it.
-
You will get a dialog, where you can change the name, number of columns in the view and the public status of the view.
-
When you have changed the fields, click the button.
7.4. Use a view
To use a view, do the following:
-
Select in the navigation menu to the left.
-
Click on the name of the view you want to use. Any public views that other users have made, you can see below your own views.
-
You can now see the all the boxes for the checks, nodes and domains you have added to this view. If the status of one of these is good, the box will have a white background, and if it is not good, the background will be either a yellow or red, corresponsing to warning or alert.
-
You can click on the title of a box to quickly get to the associated check, node or domain.
Tip: If you wish to view the same view often, it is possible to bookmark it in your browser. Then when clicking the bookmark, you will be prompted with the login-screen, and once you are logged in correctly you will be taken to the view page.
It is also possible to change the URL, so that it will log you in automatically when you use the bookmark. For more information about this feature see Section 10.1. This can be used to make the view the background on your desktop for example.
7.5. Views and domains
Every view belongs to a domain. It may be the login domain of the creating user or a subdomain of that. Placing a view in a subdomain will allow the users logging into that domain to see it, too. (Assuming the view is marked public.)
You can choose the domain, when creating the view. After that the view cannot be moved.
Chapter 8. External tools
Sometimes, when you notice a problem with a node monitored by SysOrb, you want to invoke a tool on that machine, e.g. telnet to a router, or open a remote desktop on a server. As SysOrb already knows the dns-name/ip-address of the machine, you should not have to enter that again.
If you are viewing the SysOrb web interface through Microsoft Internet Explorer, and have the Microsoft Java VM installed, then you can actually launch you favorite tools with all the parameters to connect to the node causing problems using only a few clicks.
To enable this, you must first go to your preferences, and enable "Use java for tool selection". To do this click , find yourself and click , select . Make sure that "Use java for tool selection" is enabled, and click .
When you have enabled this preference, you can click on , now you will be asked if you trust Evalesco before the browser will run the Java Applet. For now you just click , in Section 8.1 it will be explained how you can avoid seeing this message again.
You should now notice buttons labelled to the right of the screen, one next to each node in the overview. If you do not see these, please make sure that there are at least one node in the domain you are viewing, and that the Microsoft VM is installed.
You can now click next to one of the nodes. Now you will see a list of tools, initially consisting of only "Telnet". You can launch telnet by double clicking on it.
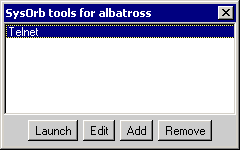
You probably want to use other tools besides telnet. By clicking you can configure additional tools. The only requirement is that the tool can be launched from the command line.
You probably want to try it in the command line, just once, to make sure you know exactly how the tool expects to get the dns-name/ip-address of the node it should connect to. For instance Putty can be lauched by writing: putty -ssh server.mycompany.com
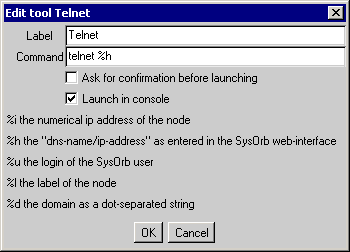
When you know the exact command to use you can fill out the fields.
-
Label: This is just used for showing on the list of tool, pick any name for your tool.
-
Command: This is the command, that should be executed to launch the tool. In order for a tool like telnet to work for all nodes in SysOrb, you must tell SysOrb where on the command line, the actual dns-name of the node should be inserted. This is done by writing %h somewhere in this field.
-
Ask for confirmation before launching: If some of your tools could potentially be dangerous, you probably want to enable this. If checked SysOrb will show an "Are you sure" dialog before actually launching the tool.
-
Launch in console: If the tool opens its own GUI window, you do not need to activate this, if it is a command line tool like telnet of ftp you must activate this.
The list of tool is stored on the machine running the browser. If you use the web interface from multiple machines, you will be able to have separate tool configurations, corresponding to the tools installted on each machines.
8.1. Avoiding security warnings
In order to avoid being warning about potentially malicious web code every time you open you browser on the SysOrb web interface, you need to install the Evalesco CA Certificate as a Trusted Root Certificate.
This is very easy, download the file ftp://ftp.evalesco.com/cert/evalesco_ca.cer, and double click it. You will now be asked if you want to install the certificate, just answer yes to all the defaults.
Now hit refresh in your Internet Explorer while holding down the ctrl-key. You should now again be asked if you trust Evalesco, (if not close every Internet Explorer window, and log into SysOrb again.) This time however, there should be a checkbox reading something like: "Always trust content from Evalesco A/S", check that and click .
Once this is done, Internet Explorer should stop warning about the certificate being untrusted.
Chapter 9. Forecasts
The SysOrb Server is capable of generating forecasts on checks monitored by the system. Furthermore, warnings can be issued based on the forecasts, enabling administrators to receive notification of possible future incidents.
9.1. Understanding forecasting
It is important to understand that the nature of the forecasts that SysOrb generates, are in many ways similar to well known forecasts such has weather forecasts. This means, a forecast is an educated guess at what a possible future state of the system could be, based on careful analysis of past observations. Like a weather forecast, a the SysOrb Forecasts do have an uncertainty associated with them.
The reliability of the forecast is highly dependent on the nature of the data for which the forecast is generated. Some data series are by nature highly chaotic, and thus unpredictable. Other types of data lend themselves well to forecasting.
We recommend that you simply set up forecasting for the checks on which you would find it useful to have forecasting. Let the forecasting run for some days or weeks, keeping an eye on the forecasts every now and then. It will quickly be evident which data series are simply impossible to forecast reliably, forecasting on those can then be disabled.
9.2. How the forecaster works
Once forecasting is enabled on a check, the forecaster will look at the data available from that check. The forecaster requires some data history to be available in order to even consider if a forecast is possible. Please make sure that you have at least a few days worth of data available - otherwise the forecaster will simply show you a "no forecast available" message in the web interface.
Once sufficient data material is available, the forecaster will examine these data looking for various properties, such as "periodicity", to assess whether the data is chaotic, or more or less repetitive in its nature.
The forecaster will then attempt to "model" the data set. This means, to generate a mathematical model that can re-produce the known past observations. This is a rather complicated process, and it can take many minutes (even hours on slow computers) for it to construct this model. If no suitable model can be found, the forecaster will show that "no forecast is available" in the web interface. In this case it will re-try the modelling every few hours, as new observations become available to it.
Once a model is successfully built, the forecaster will produce the actual forecast based on that model. The generation of the forecast is a relatively simple operation, once the forecast model is available. The forecast will be updated every 30 minutes, to reflect the latest changes in the observed data.
9.3. Configuring a forecast
From the check configuration page (see Chapter 4), you can enable and configure the forecast properties as well:
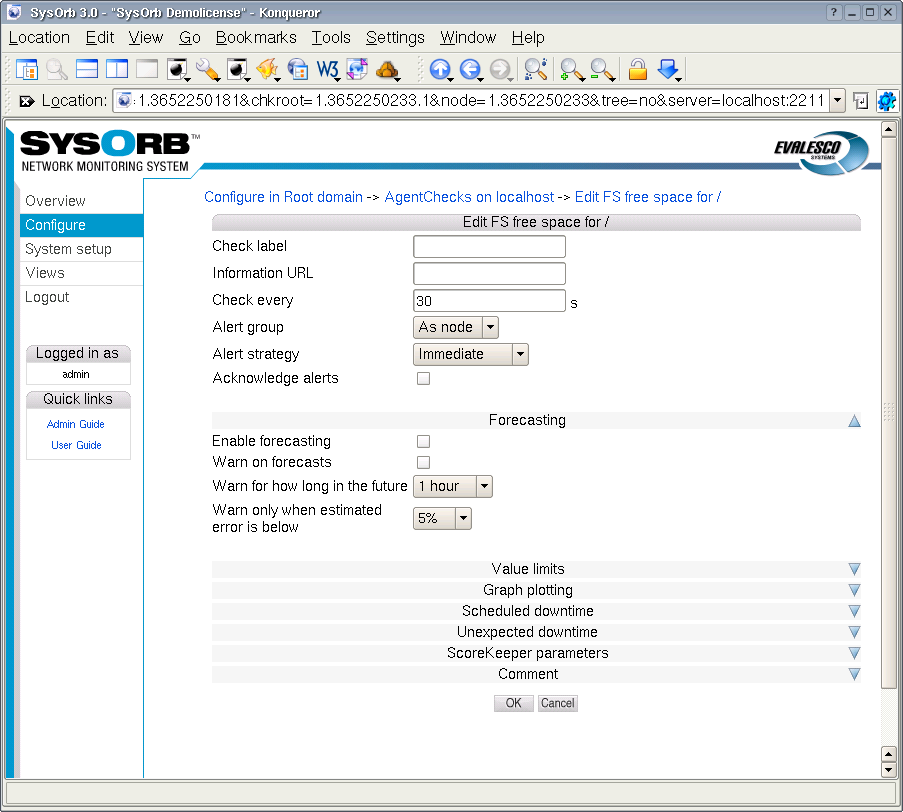
In the Forecasting section, you have the following options:
-
Enable forecasting: In order to have forecast models generated for this check, and to have the actual forecasts generated automatically, this option must be selected.
-
Warn on forecasts: Once a forecast is generated, the forecaster can look through the forecast values and warn administrators of any potential future problems the forecast may indicate.
-
Warn for how long in the future:Depending on the nature of the data that are forecast, forecasts will turn out to be reliable for longer or shorter periods of time. You may find, that forecasts for certain checks are only reliable for, say, two hours. Other forecasts may be reliable for days. Using this option you can specify how long into the future you want the forecaster to look for conditions that may result in a warning condition. Specifying "1 Hour" means, that while the forecast may be generated for several days into the future, only the first hour of the forecast will be examined for conditions that can result in a warning being sent to the administrators.
-
Warn only when estimated error is below: The forecaster can estimate the error margin on the forecast data, based on simulations on past observations. This option lets you specify the maximal error estimate that a forecast can have, in order to be used as basis for forecast warnings. For example, if you specify "5%", a forecast with an estimated error of "7%" cannot result in warnings being sent to administrators. Any forecast with an error above the threshold set here, will be deemed unfit for use as basis for forecast warnings.
These simple configuration options on the check configuration page is actually all there is to the forecasting configuration.
Chapter 10. Special purpose Web-interface features
10.1. Automatic webinterface login
Sometimes you may want to have a directly clickable link from some internal web page, into a specific SysOrb status page. You cannot just copy the content of the address bar, while viewing the SysOrb status page, because the url contains a session identifier, which probably will no longer be valid, when following the link later.
Instead your should paste the url from the address bar into your favorite text editor, and cut out the session_id parameter.
Example 10-1. Link to a status page
http://albatross/sysorb/index.cgi?path=1.1.1&node=1.2260370556 &server=albatross:2222&session_id=224366472 becomes http://albatross/sysorb/index.cgi?path=1.1.1&node=1.2260370556 &server=albatross:2222
Following the above link will show the usual SysOrb login screen, but once the user logs in, he will be taken to the status page from the original url.
The login process can be automated further. In order for SysOrb to verify a user login, it needs a username, a password, and the domain in which to look up the username. Any or all of these three parameters can be passed through the link url. If all three a given, SysOrb will not show the login page, but jump directly to the status page. If one or more are not given, SysOrb will show a partially filled in login form.
The url parameters in which you specify the login information is
called username, passwd and tld.
Example 10-2. Link to a status page with automatic login
If you have a user john with password doe in the root domain. The followin url will log in as john, and show the same status page from the example above: http://albatross/sysorb/index.cgi?path=1.1.1&node=1.2260370556 &server=albatross:2222&username=john&passwd=doe&tld=.
When creating links like this, be sure that the user has only viewing capabilities, or anyone looking at the browser history, or at the html source will be able to log in and reconfigure your SysOrb system.
10.2. Removing naviation buttons and top bar
If you want to include a SysOrb status page in a frame within a larger page, you may not want the SysOrb navigation buttons and top bar to show up inside the SysOrb frame.
You can suppress these bars by adding the parameter disabletop=yes to the url. A frame html tag may
look like <frame
src="http://albatross/sysorb/index.cgi?path=1.1.1&node=1.2260370556
&server=albatross:2222&username=john&passwd=doe&tld=.&disabletop=yes">
10.3. Making the SysOrb overview available to other programs
As a way to import the information from the SysOrb overview page into other programs, the Web interface has a special page, which outputs an overview of all nodes and domains in plain text.
In order to view this page, type in the following URL in our browser:
http://localhost/sysorb/index.cgi?path=2&username=your
login &passwd=your
password&tld=domain&server=servername:port
Where your login, your password, domain are replaced with the values normaly used to login (for the default user these are "admin", "admtest" and "."). The servername and port should be the dns-name of the SysOrb Server and the port it is running on. If the Webinterface runs on the same server as the SysOrb Server these values are "localhost" and "3241"
The output from this page has the following layout:
SysOrb text overview page

world   N: Ugly C: Good A: Good
*** Nodes ***
        test.sysorb.com N: Good C: Good A: Good
        *** NetChecks ***
                 [HTTP/80]      Good
        *** AgentChecks ***
                FS free space for /home Good
                FS free space for /     Good
                Free Memory for phys    Good
                Free Memory for swap    Good
                Free Memory for virt    Good
                System Load for load    Good
                Process Presence for httpd      Good
                Process Presence for init       Good
                Process Presence for syslogd    Good
                Process Presence for ntpd       Good
                System Uptime for uptime        Good
                RAID status for md0     Good
                System handles for alloc_fh     Good
                System handles for alloc_ino    Good
                System handles for free_fh      Good
                System handles for free_ino     Good
                Interface throughput for total receive drops eth0       Good
                Interface throughput for total receive errors eth0      Good
                Interface throughput for total received bytes eth0      Good
                Interface throughput for total transmitted bytes eth0   Good
The format is simple. After the introductionary line at the top the first line encountered is the name of the domain, the user is logged in to. After the name of the domain a there is a TAB character, and then the status for Network, Checkin and Agents, again seperated by TAB characters.
The next line is an identification line, which can be one of two. If there are subdomains in the users root-domain, the line is *** Domains ***, otherwise it is *** Nodes *** just as in the example above.
The lines following the identification line, will all be indented by a TAB character until another identification line is outputtet for the current domain, or the information for another domain is outputted.
After the *** Domains *** (if present) line all the subdomains to the current domain will be listed in the same way as the root domain is.
After the *** Nodes *** line all the nodes in the current domain will be listed, with their name first on the line, and the status after it, just like the status for the domain.
After the node line comes another identification line which can be either *** NetChecks ***, *** AgentChecks *** or *** snmpChecks ***. Afther the identification line, all the checks of the given type is listed, again idendented with another TAB character. After the name of the check, the status for it is listed.