2.4. Interpreting SysOrb graphs
Once the first checks have been set up and data are flowing into SysOrb, you can click on the status line for a check to see the historical data stored for that check.
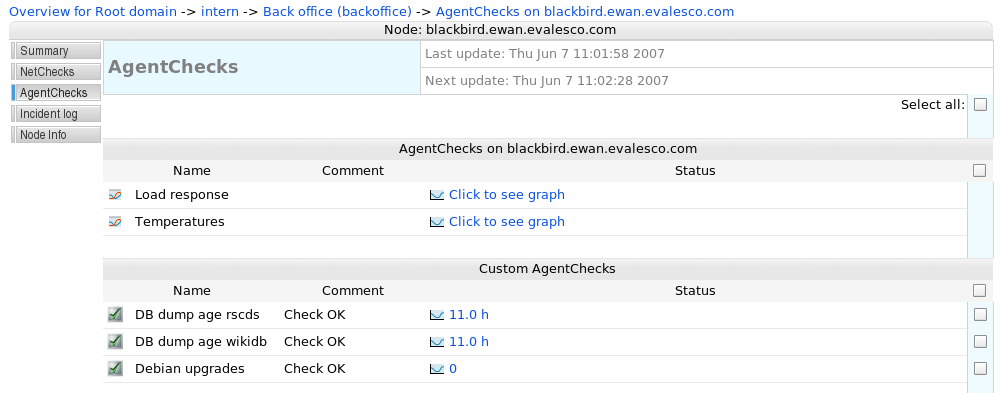
A list of agent checks on a node - clicking on the status links will display the graphs of actual historical data
There are several types of graphs in SysOrb, because there are several types of data that can be monitored: Continuous data such as temperatures, disk space, response times etc. are displayed as curves in a coordinate system. Enumeration data such as RAID disk status, switch port status, process presence etc. are displayed on a special "time line" with colored areas depicting both the actual readout value of the check ("degraded", "missing" for RAID for example) and the status of that value ("warning", "alert" for example). Uptime graphs provide a flexible display of how long a system has been up, and when it has rebooted.
2.4.1. Continuous graphs
Continuous graphs hold a lot of information. In its most simple form, the graph will show the evolution of a single check result over time. At the top of the graph, a line shows "Min", "Avg" and "Max" numbers; these are the minimum, average and maximum numbers recorded in the period shown. Please note, that the deep-blue curve drawn represents averages over short intervals, and therefore the top and the bottom of the curve may not correspond to the "Min" and "Max" numbers printed at the top of the graph. In order to actually see the real minimum and maximum values too, one can click the "Show min/max" checkbox at the very left of the web interface (not shown in the images here).
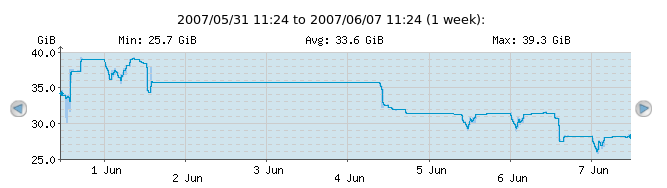
A very simple check; free space on a filesystem, as it has evolved over time
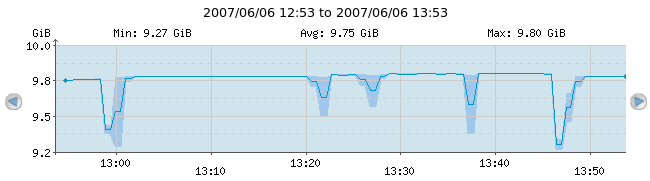
Notice the blue shade around the deep-blue curve around the times when the curve changes a lot
Warning and alert thresholds are also shown on the continuous graphs. In the following example, the check has "Warn when above" set to 400ms and "Alert when above" set to 800ms.
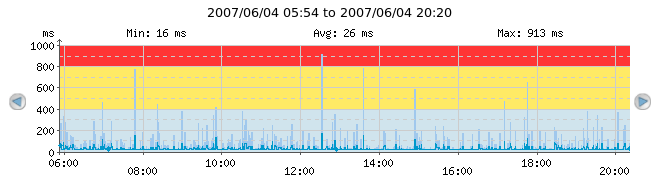
The red shaded area symbolizes the area in which the check would be in alert state with the current thresholds. The yellow shaded area symbolizes the area in which the check would be in warning state with the current thresholds
Packet loss on for example ICMP Ping checks (or other loss of data, depending on the check type) can be shown in the continuous graphs, if the "No response %" checkbox is clicked.
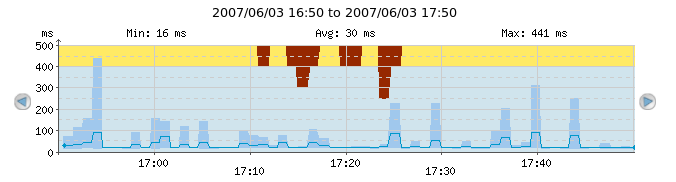
The dark-red shades from the top of the graph symbolize packet loss. On most of the graph, the packet loss is 0% because there is no dark-red shade; but from 17:10 till around 17:25 we see from zero to 50% packet loss
2.4.2. Enumeration graphs
Enumeration graphs depict the state of a check over time. The following graph shows the results of a SAF-TE SCSI enclosure disk check. There are two colored areas in the enumeration graph; the tallest top area displays the check result ("No error", "Rebuilding", "Predicted fault", etc.) while the shorter bottom area is either green, yellow or red and displays the SysOrb alert status ("ok", "warning", "alert").
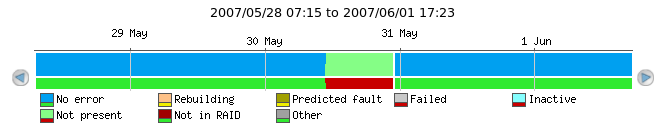
Most of the time, this disk has had "No error" which resulted in an "ok" status (green). From around mid-day on May 30th till almost midnight, the disk was "Not present" which resulted in "alert" status (red).
2.4.3. Uptime graphs
Uptime graphs provide a quick overview of how long a given system has been up and running, when it last rebooted, and how frequently it is rebooting.
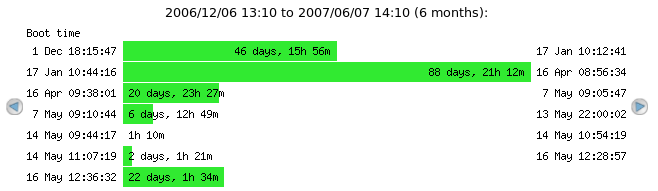
From the bottom-most bar, we can see that this particular system was last booted on May 16th around 12:36 and has been running for a little more than 22 days so far