4.8. MultiCheck graphs
Presenting the results from multiple checks in a single graph can provide insights into how different checks interact or simply provide a more detailed view of the current status on a monitored device or system. MultiChecks provide a way of configuring a view of multiple existing checks in a single graph.
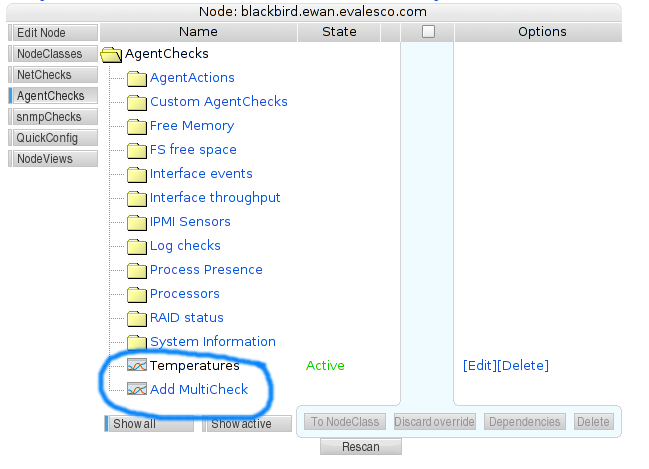
You can add a MultiCheck anywhere where you can have checks; under NetChecks, AgentChecks or SnmpChecks. Simply go to under a node, and select .
After clicking the button, a name for the MultiCheck must be specified. Pick any short and descriptive name that would fit the MultiCheck you wish to create. In this example, we name it Load response, because we wish to display the response time of the server against the load of the server, to see if the response time is affected noticeably by the load of the server.
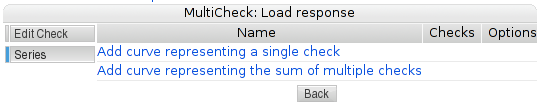
Once the empty MultiCheck has been named, it is now possible to add either single series or sums of a set of series to the MultiCheck.
One can add any number of checks to a MultiCheck. However, it is rarely practical to add more than 4-8 checks, because the resulting graphs become increasingly difficult to interpret. Another thing one should consider, is the unit of the included checks. The graph routines in SysOrb will add more axes to the graph to accommodate one unit per axis. If one adds many checks with different units, the graph will become much more difficult to read for most users, as graphs with more than two or three axes are not commonly used elsewhere.
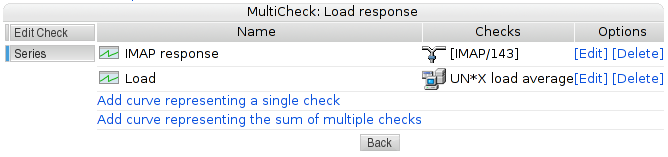
Once the series we want in the MultiCheck have been added, the check configuration should look something like the image below.
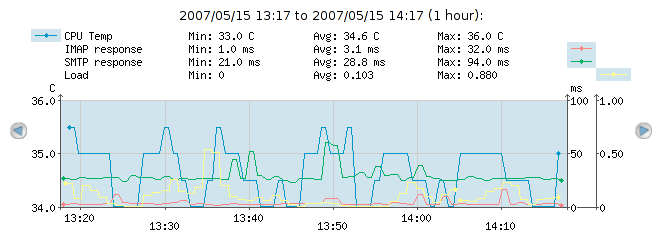
Clicking to the left will take us from mode to mode, and will show us the MultiCheck. Take a look at the example image below, and read on for the explanation of the graph.
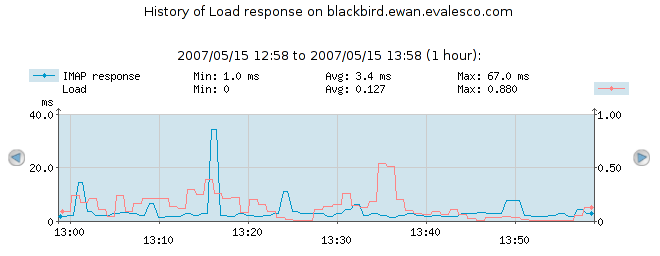
Looking at the right-side and left-side axes, it is also clear why the two checks are associated with each their axis. The left-side axis (response time) represents 0 to 40 ms, while the right-side axis (load) represents a (unit-less) load average from 0 to 1.
The above begs the question; what happens with the axes as we add more series? In that case, SysOrb attempts to do the most sensible thing; it will collect all series which use identical units on the same axis. And it will add axes as needed, to accommodate every unit used. The end result will be a graph with as few axes as possible. In the example below, we have added SMTP response (which is measured in ms just like the IMAP response), and processor temperature (which is measured in Degrees Celsius, which will be the 3rd unit we add to the graph).