4.4. Setting Up Checks
Before the SysOrb Server can tell you what problems, if any, there are on your network, you need to tell the SysOrb Server what to monitor. The results of all types of checks are stored by the SysOrb Server and are checked to see if the host in question is behaving as expected. If abnormal behavior is detected a warning or alert will be raised.
4.4.1. NetChecks
These checks can be performed without a SysOrb Agent being installed.
NetChecks on services are performed by using one of these 8 protocols:
-
DNS: Asks a DNS-server to translate a hostname to an IP-address, and matches the returned IP-address with a user specified list of valid IP's.
-
FTP: Tries to log on the node's FTP-server with a specified username and password. If no username is specified, it is only checked that the FTP-banner is returned.
-
HTTP: Connects to an HTTP server on the node and tries to retrieve an URL defined as part of the check.
-
ICMP: Sends an ICMP PING to the node and listens for a reply. This is basicly the same as the ping-program does.
-
IMAP: Connect to the node and examines whether the IMAP server is running or not. This is done by logging in and logging out again.
-
POP3: Connect to the node and examines whether the POP3 server is running or not. This is done by logging in and logging out again.
-
SMTP: Connects to the node and examines whether there is an SMTP server running there or not.
-
Generic TCP: This simply tries to make a TCP connection to the specified port on the node. If a connection can be opened this check is considered successful.
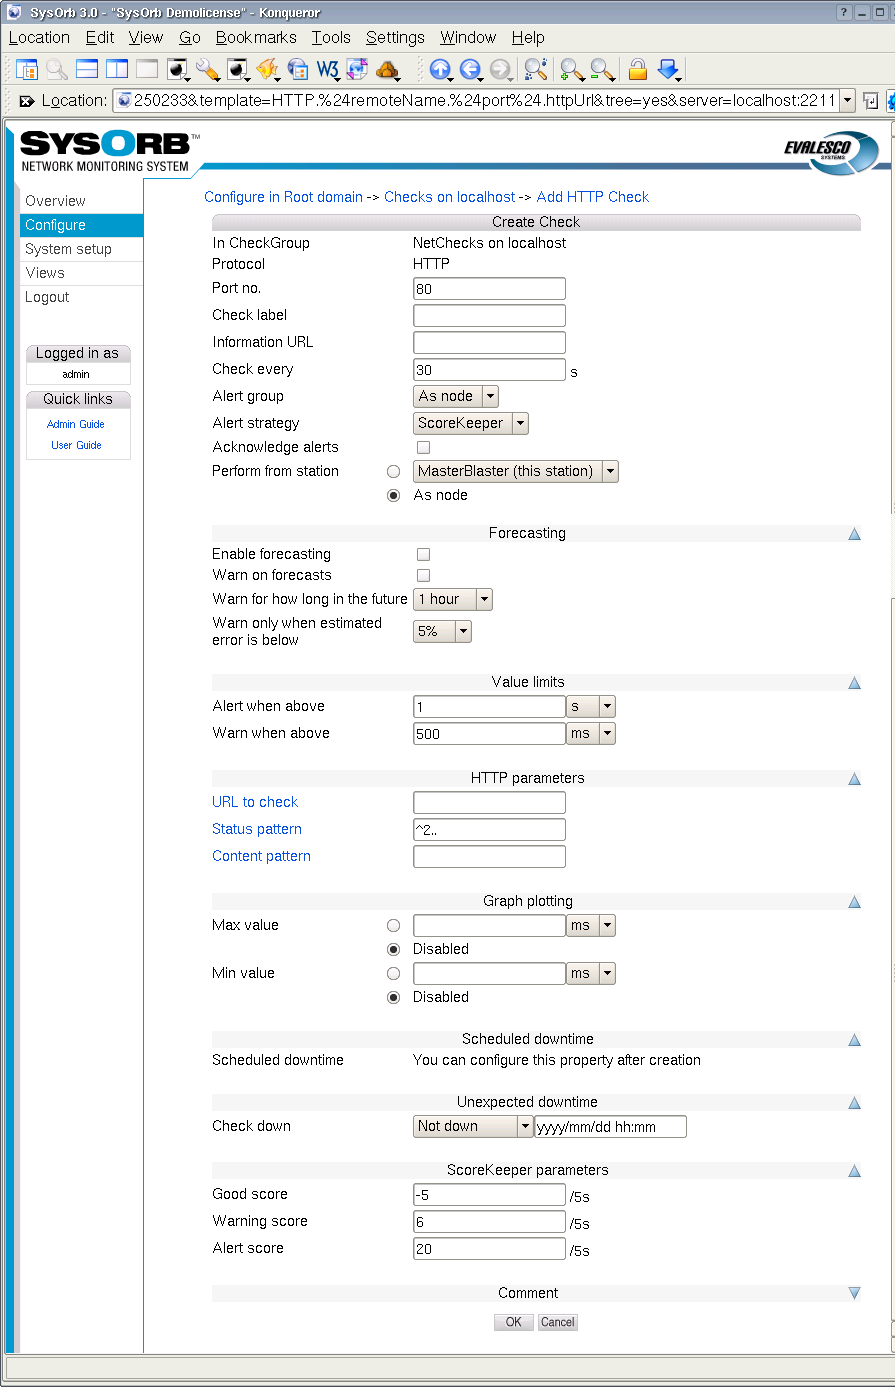
When setting up a NetCheck you can set the following options:
-
Port no.: The port the SysOrb Server should perform the check on. For ICMP checks this option does not exists.
Default value: (Depending on type of check)
-
Check name: A name by which you will recognize the check.
Default value: (empty)
-
Information URL: If you have additional documentation regarding this check for the operators, you can supply an URL here, and SysOrb will show a link to the documentation on the various listings where this check appears.
-
Check every: Number of seconds between each time this check should be performed.
Default value: (Depending on type of check)
-
Alert group: When a warning or alert is raised this group will be notified.
Possible values: None, As node, As domain, AlertGroupX, AlertGroupY,...
Default value: As node
-
Alert Strategy: This allows you to select the method for determining when an administrator should be alerted about this check. The two possible values are Immediate and ScoreKeeper. Please refer Section 1.3 for more information about how this works.
-
Acknowledge alerts: When this option is checked, the check will never return to the good state automatically. This is instead done manually by an administrator. This is especially usefull for LogChecks. For more information please refer to Section 1.3.
-
Enable forecasting: When this box is checked, SysOrb will try to generate forecasts about how this check will behave in the future. These forecast will be visible when viewing a graph of the check, by scrolling into the future. Please refer to Chapter 9 for a full description on setting up forecasting.
-
Warn on forecasts: Enabling this option, will allow the forecaster to send out warnings concerning this check, if the forecast shows that the check will fail in the future. The warning is sent out whenever the forecaster completes a forecast. This happens once every half hour.
-
Warn for how long in the future: This function tells the forecaster, for how long in the future it should check that the forecast is within the bounds specified for the check. Only the time-interval specified here will be checked.
-
Warn only when estimated error is below: This option allows you to finetune how certain the forecaster should be, before the alerts are sent out.
-
Alert when above: If the response time of the check is longer than this value we consider this check seriously unsuccessful and raise an alert.
Default value: (Depending on type of check)
-
Warn when above: If the response time is below this value we accept the check as successful. If the response time is above this value we raise at least a warning if not an alert, as above.
Default value: (Depending on type of check)
-
Min value: When this value is set, the lowest displayed value whenever a graph for this check is being drawn, is fixed at this value.
-
Max value: When this value is set, the greatest displayed value whenever a graph for this check is being drawn, is fixed at this value.
-
Scheduled downtime: Some checks are only relevant in certain periods, for instance during working hours. SysOrb can be instructed only to send warnings and alerts during these periods. It will still perform the checks around the clock for statistical purposes, just not send warnings or alerts outside working hours.
You configure this by specifying all the time intervals of the week, for which SysOrb should not send warnings or alerts. For instance if you want SysOrb to monitor a server from 8 am to 4 pm every workday, you would add downtime intervals from 0:00:00 to 8:00:00 and from 16:00:00 to 23:59:60 on each of Monday to Friday, and one interval from 0:00:00 to 23:59:60 on Saturday and Sunday.
Note: If all checks on a node should be monitored during the same set of intervals, you can set up the downtime intervals for the node, instead of for each check.
-
Unexpected downtime: When SysOrb detects a problem on a check, you sometimes know that someone will deal with it at some specific later time. You do not want to be flooded with SysOrb messages until then. In that case you can use these fields to instruct SysOrb not to send any warnings or alerts regarding this check until some later point in time.
Using the drop-down box labeled Node down you can select that the check will be down for 1, 3, 6 or 24 hours. You can also select the option named "Until", and enter a date and time in the text field to the right.
-
Good score: This value is added to the check's score every five seconds, if the last check was successful, i.e. if the response time was below Warn when above.
Default value:
-5 -
Warning score: This value is added to the check's score every five seconds, if the last check resulted in a warning, i.e. if the response time is between Warn when above and Alert when above.
Default value:
6 -
Alert score: This value is added to the check's score every five seconds, if the last check resulted in an alert, i.e. if the response time is higher than Alert when above.
Default value:
20
In addition to these, some of the NetCheck types require extra parameters.
-
ICMP, SMTP: No extra parameters.
-
HTTP: For the HTTP check you can specify which URL it should check.
Depending on how the node is configured, this can be done in several ways. There is only one domain hosted on the server, you can type the path to the page that SysOrb should retrieve, e.g. /secret/web-db-test.php.
If the node is configured to host several web-sites, you can specify the entire URL, e.g. http://www.mydomain.com/secret/web-db-test.php
Note: The return code for the page that SysOrb checks, must be one of the 200-codes. E.g. an URL that redirects the browser to another page, will result in failure of the check, as will a page that does not exist.
-
IMAP, POP3, FTP: You may optionally specify the login and password of an account on the monitored server. If one is given SysOrb will try to log in and perform some basic operation (like listing the mails/files). If not SysOrb will just connect to the server, and wait for the login prompt.
-
DNS: You must supply a dns-name to be resolved, and a comma separated list of numerical IP addresses. The check is considered successfull if the monitored server resolves the dns-name to one of the given IP addresses.
Note: The default values of dnstest.sysorb.com and 10.0.0.42 is a service, which allows you to check the external DNS resolution works as it should. These values are guaranteed not to change.
-
Generic TCP: You must specify if SysOrb should also wait for the connection to close, after it has been opened. Most server applications detects immediate hang-up from the client, and closes willingly. But some do not, and the check fails if you do not specify that SysOrb should not wait for the connection to close.
To enable a NetCheck on a node, do the following:
-
Select the button from the navigation buttons at the left.
-
Navigate through the domain tree until you reach the domain where the node is located
-
Select the Edit option for the node you wish to configure a new NetCheck on.
-
Press the button on the left.
-
Select the type of check that you wish to add, by pressing the appropriate button.
-
Specify the check parameters for the NetCheck.
-
Press the button to add the NetCheck to the chosen node or the to discard the check.
4.4.2. AgentChecks
In SysOrb the term AgentCheck covers a number of things on a host machine that can only be checked by the host itself by running the SysOrb Agent on it. Some of the checks you are able to monitor on hosts running SysOrb Agents are:
-
Free space: Monitors the amount of free space on hard drives and the like on the host.
-
Free memory: Monitors the amount of free virtual and physical memory as well as available swap space.
-
System Load Average: The average system load (Unix).
-
Process presence: Check whether a named process is running on the host.
-
System Uptime: The time that has passed since the system was last booted.
-
Logs: The SysOrb Agent can scan log files, and report whenever a line matches given patterns.
Depending on the operating system of the host running the SysOrb Agent, it may support many other types of AgentChecks. Please consult the SysOrb brochure for the full list.
Any AgentCheck belongs to one of three groups. One group results in a numerical value, such as free space, load, temperature etc., we call these checks continuous. The other group results in one of a number of cases, such as processes (present, absent), RAID (OK, degraded, failed) etc., we call these checks enumerations. The last group is the LogChecks, which return a line.
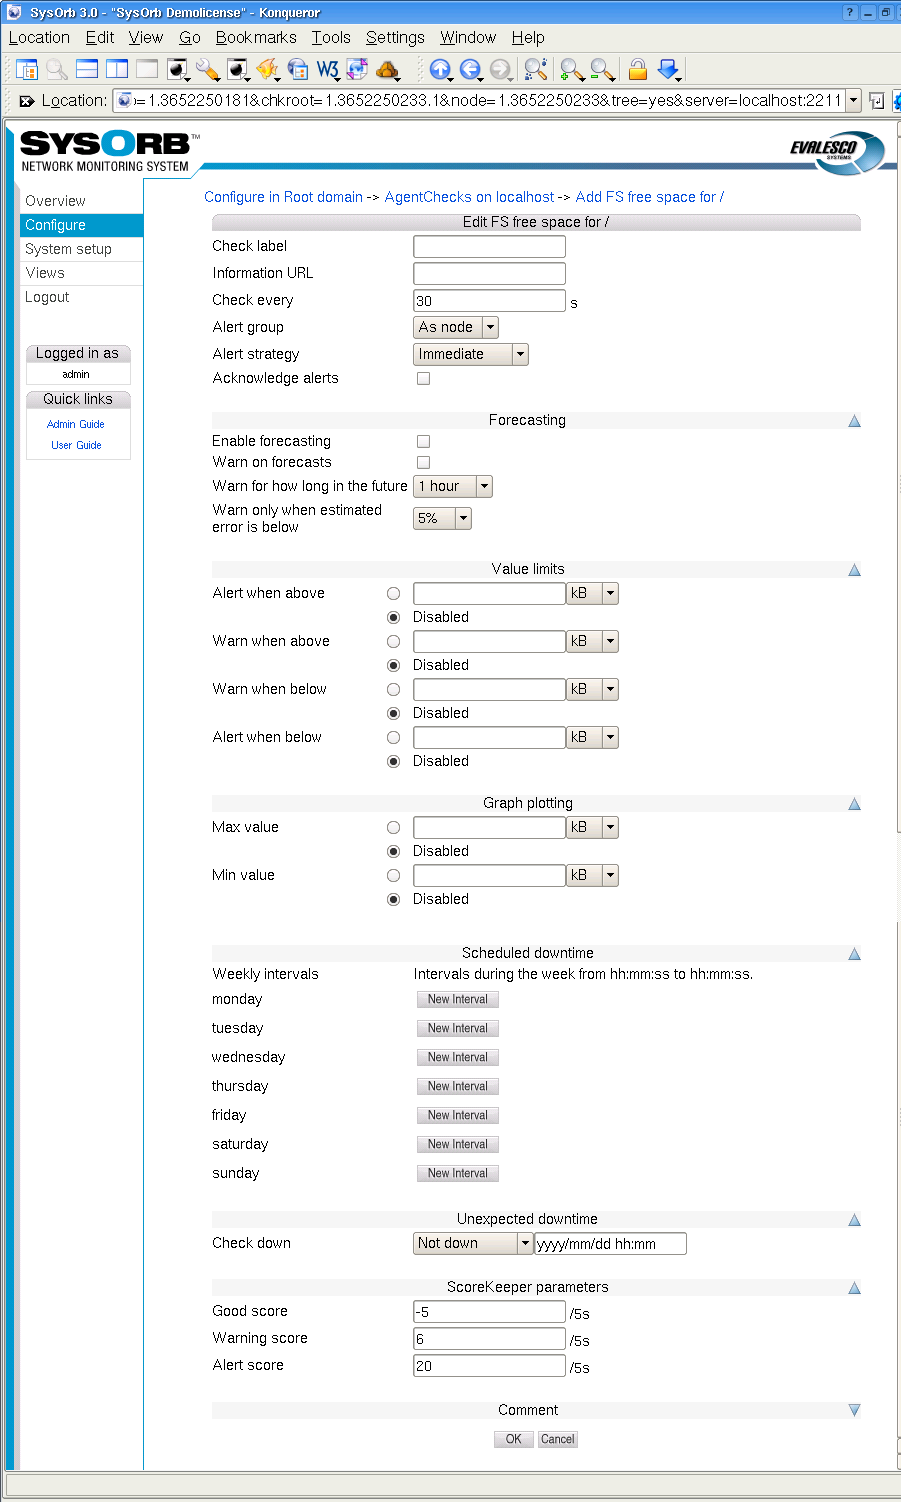
All AgentChecks share the common configuration options listed below.
-
Information URL: If you have additional documentation regarding this check for the operators, you can supply an URL here, and SysOrb will show a link to the documentation on the various listings where this check appears.
-
Check every: Number of seconds between this check should be performed.
Default value: 30
-
Alert group: If this check results in a warning or an alert being raised this group will be notified.
Possible values: None, As node, As domain, AlertGroupX, AlertGroupY,...
Default value: As node
-
Alert Strategy: This allows you to select the method for determining when an administrator should be alerted about this check. The two possible values are Immediate and ScoreKeeper. Please refer Section 1.3 for more information about how this works.
-
Acknowledge alerts: When this option is checked, the check will never return to the good state automatically. This is instead done manually by an administrator. This is especially usefull for LogChecks. For more information please refer to Section 1.3.
-
Enable forecasting: When this box is checked, SysOrb will try to generate forecasts about how this check will behave in the future. These forecast will be visible when viewing a graph of the check, by scrolling into the future. Please refer to Chapter 9 for a full description on setting up forecasting.
-
Warn on forecasts: Enabling this option, will allow the forecaster to send out warnings concerning this check, if the forecast shows that the check will fail in the future. The warning is sent out whenever the forecaster completes a forecast. This happens once every half hour.
-
Warn for how long in the future: This function tells the forecaster, for how long in the future it should check that the forecast is within the bounds specified for the check. Only the time-interval specified here will be checked.
-
Warn only when estimated error is below: This option allows you to finetune how certain the forecaster should be, before the alerts are sent out.
-
Min value: When this value is set, the lowest displayed value whenever a graph for this check is being drawn, is fixed at this value.
-
Max value: When this value is set, the greatest displayed value whenever a graph for this check is being drawn, is fixed at this value.
-
Scheduled downtime: Some checks are only relevant in certain periods, for instance during working hours. SysOrb can be instructed only to send warnings and alerts during these periods. It will still perform the checks around the clock for statistical purposes, just not send warnings or alerts outside working hours.
You configure this by specifying all the time intervals of the week, for which SysOrb should not send warnings or alerts. For instance if you want SysOrb to monitor a server from 8 am to 4 pm every workday, you would add downtime intervals from 0:00:00 to 8:00:00 and from 16:00:00 to 23:59:60 on each of Monday to Friday, and one interval from 0:00:00 to 23:59:60 on Saturday and Sunday.
Note: If all checks on a node should be monitored during the same set of intervals, you can set up the downtime intervals for the node, instead of for each check.
-
Unexpected downtime: When SysOrb detects a problem on a check, you sometimes know that someone will deal with it at some specific later time. You do not want to be flooded with SysOrb messages until then. In that case you can use these fields to instruct SysOrb not to send any warnings or alerts regarding this check until some later point in time.
Using the drop-down box labeled Node down you can select that the check will be down for 1, 3, 6 or 24 hours. You can also select the option named "Until", and enter a date and time in the text field to the right.
-
Good score: If the check is successful this value is added to the check's score.
Default value:
-5 -
Warning score: If the check exceeds the warning tresholds, as specified above, this score is added to the check's score.
Default value:
6 -
Alert score: If the check exceeds the alert tresholds, as specified above, this score is added to the check's score.
Default value:
15
In addition to these settings continuous AgentChecks have the following options. The appropriate units depending on the actual check, e.g. MB for free disk space, are listed to the right of these fields.
-
Alert when above: If the monitored value climbs above this threshold an alert will be raised.
Default value: Disabled
-
Warn when above: If the monitored value climbs above this threshold a warning will be raised.
Default value: Disabled
-
Warn when below: If the monitored value drops below this threshold a warning will be raised.
Default value: Disabled
-
Alert when below: If the monitored value drops below this threshold an alert will be raised.
Default value: Disabled
Note: When the value crosses any of these boundaries, a warning or alert may not be sent immediately. This depends on the Alert Strategy setting, and the score settings if the ScoreKeeper strategy is selected. Please refer to Section 1.3 for an explanation.
Enumeration AgentChecks have one option for each state the check may result in. That option determines if a warning or alert is to be be raise, should the check result in the given state. The possible settings for each state are Good, Warn or Alert.
When deciding on warning and alert tresholds be sure to choose meaningful values. For example, if you monitor a database server with approximately 10GB data on a 15GB device it would not make sense to raise an alert when there is less than 1GB free space. The other way around it would make sense to raise a warning, or possibly an alert, if there is more than 10GB free space as this might be caused by unexpected loss of data in the database.
As noted above all thresholds are disabled by default which means that when enabling a AgentCheck you need to consider not only what to monitor but also how you monitor it. Even if you create a check, with all the thresholds disabled, you will still be able to view the graphs for the device, so this is a good way to document how much a machine is stressed.
To enable an AgentCheck on a host, do the following:
-
Select the button from the navigation buttons at the top.
-
Browse into the domain containing the host in question.
-
Select the Edit option for the host you wish to configure a new AgentCheck on.
-
Press the button on the left.
-
Press the button to get a tree of all AgentChecks found by the Agent.
-
Press the button to configure an AgentCheck.
-
Specify the check parameters for the AgentCheck.
-
Press the button to add the AgentCheck to the chosen host or the to cancel.
4.4.2.1. LogChecks
The SysOrb Agent can scan log files for error messages, or for unexpected messages. Before you are able to configure any LogChecks, you will need to tell the Agent which files may be monitored. This is a safety measure, guarding agaist a compromised SysOrb Server being able to retrieve a copy of any file on the hosts running SysOrb Agents. (See the Administrator's Guide for more information on how to configure the SysOrb Agent to allow LogCheck).
If you see a group called LogChecks beneath AgentChecks, then you are ready to go on. Browse through the directories below the LogChecks group to find the file you want to monitor.
When scanning a log file, the Agent will start from the position where it stopped the last time. (End of file at that time.) That means that scanning the log file frequently (e.g. every 30 seconds) does not mean, that the entire file is read through twice every minute.
The Agent must know how to separate the entries of the log files. Many log files contain one entry per line, other separate the entries by a line with only dashes, or by an empty line. This can be configured for each log file in the web interface.
After splitting the log file into entries, the Agent will look at one entry at a time, and based on a set of rules determine whether that particular entry should be reported to the SysOrb Server, and if it is a warning or alert, or just an informational message.
How to split the entries, and the rules to apply to each of them afterwards is specified through the following configuration options specific for LogChecks:
-
Separator: A POSIX regular expression that describes the separator text between two adjacent log entries. The default '\r?\n' is to use each new line as a log entry.
Please Note: Certain characters must be prepended with a backslash (i.e. \), if they are to be used to specify a separator. These are:
. [ \ ] ( ) * ^ $ + ? { }
|
For more information about regular expressions, please see http://www.regular-expressions.info/tutorial.html
Default value: \r?\n
-
Separator inclusion: This field can take one of three values, that determines what to do with the log entry separator. It is only useful if your separator pattern may match something non-trivial, that you want to include with the log entry. "Append to previous entry" will append the separator to the entry just before the separator. "Prepend to next entry" will prepend the separator to the next entry found. "Discard the separator" will just throw away the separator and only consider the text between separators as entries.
Default value: Discard the separator
-
Rules: This text box is used to enter rules. The rules specifies which log entries that should be handled, and what to do with them. Each rule is terminated by a semicolon and consists of two parts separated by a colon.
An example of a rule could be 'Error': alert log;. This rule will make sure that all lines containing the string Error (case sensitive) will result in an alert, and be logged in the database.
The left part of the rule specifies which log entries should match this rule. The syntax is that of a POSIX regular expression enclosed in single quotes. It is also possible to have a number of regular expressions separated by and, or. Any regular expression can optionally be preceeded by not. Example: 'Error on' and 'Drive' and not 'empty', will match entries containing both Error on and Drive in no particular order, but not containing the the string empty anywhere.
The right part of the rule specifies what to do with an entry matching the rule. It can be one of the states: ok, warm, or alert, followed by one of the actions: log or quiet, which tells whether the entry should be logged on the SysOrb Server in order for you to view later.
Another example of a rule could be '[Ee]rror': alert log;. This rule will make sure that all lines containing either the string Error or error, will result in an alert, and be logged in the database.
If multiple applications write into the same log (e.g. the Windows Event Log) you may want to split that log into multiple LogChecks, which will show warning and errors individually on overview pages and mail notifications. This can be achived with the LogCheck forwarding feature of SysOrb.
Example of forwarding: '^[^:]*:Browser:': moveto 'Browser'; this will cause all entries having Browser between the first and second colon on the line to be moved into a LogCheck called Browser (which will be created if it does not exists). The moved entries will be processed through all of the rules of the LogCheck called Browser, and be logged over there if the rules says so. The entries will not be processed through the remaing rules of the originating LogCheck, in order for this to happen use copyto instead of moveto.
You can insert comments in the list of rules by starting a line with '#'. SysOrb will ignore these lines when processing the log.
Default value: Empty
When configuring a new LogCheck you can start by putting the catch-all rule '.*': ok log; as the very last (or maybe only) one. That will log everything to the SysOrb server. You will probably quickly find out a number of messages, that you do not want to see in the web interface. You should put the rules for those above the catch-all rule, that way any unexpected message will still turn up in the web interface, for you to decide if it should be ignored or not. After a while you could even modify the catch-all rule to result in warnings if any unexpected messages turn up.
From SysOrb 4.2 the log check rule system has been extended so that moveto and copyto actions now can be given alert groups as destinations.
Example rule set: 'test': moveto @'name_of_your_group';
The above rule collection will make sure that anyone in the "Intern" alert group get copied on events from the log that match the rule.
Note that the notification which is sent is not an alert. The notification send using this rule will bypass the alert system in SysOrb.
The above log check rule could be used in situations where it is needed to be notified of every single occurrence of a given event.
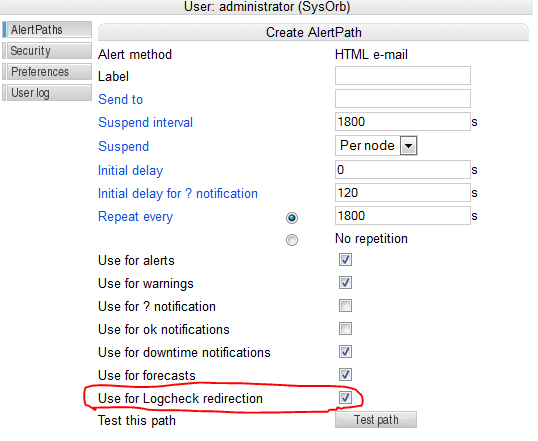
In order to make this rule work the Use for Logcheck redirection needs to be ticked on the user's AlertPath.
4.4.2.1.1. Event Log checks
A SysOrb agent running on Windows is able to check the Event Logs in addition to text log files. Event Logs are handled slightly different than ordinary log files
Checking of any Event Log is enabled per default on the SysOrb agent. If you consider it a security problem that SysOrb users will be able to configure a check on for instance the security Event Log on all your machines, then you should disable this feature on the Agent, before starting it. See the Administrator's Guide for more information on how to configure the SysOrb Agent with respect to which files will be permitted for LogChecks.
First off, the Event Log is already divided into separate entries, and thus SysOrb does not need a separator pattern to find out when one entry ends and the next begins.
The other difference is that an Event Log entry has more to it than a simple string of text, but the regular expressions in the rules are only able to handle strings. Therefore the SysOrb agent converts every Event Log entry into a string in the following way.
The Agent composes a colon-separated string of the following form: type:source:category:event_id:user:computer:description for instance: Information:SNMP:0:1001:N/A:MyComputer:The SNMP Service has started successfully.
This string is then tested against the patterns in the rules, and sent to the server if it matches.
A very simple rule could look like this:
'SNMP': warn log;
The pattern matches every string containing SNMP. And causes it to be logged with a yellow warning icon. The above example string contains SNMP (twice), so that would be logged.
This rule is a bit too simple, as it would also match unrelated Event Log entries, which happen to contain the word SNMP somewhere in the desription text. (That could just be part of a filename.) We really want the rule to match only entries, whose source is SNMP. That can be done, but first we will consider a simpler case.
In this rule
'^Information': ok quiet;
the caret causes the pattern to match only when the word Information appears at the very beginning of the string. This will match all information type messages, without catching errors or warnings, which happen to contain the word Information in the description text.
We can now proceed with the SNMP example:
'^Error:SNMP:': alert log;
This pattern will match all strings beginning with Error:SNMP:, i.e. error messages whose source is SNMP. (As source is the second field in the colon delimited string.)
To catch both errors and warnings related to SNMP one can write:
'^(Warning|Error):SNMP:': alert log;
The pipe and parenteses mean that either Warning or Error must preceed the first colon in order for this pattern to match.
If you want to match every record from the SNMP source, regardless of the event type, you can use the regular expression [^:]*, which matches any number of characters as long as there are no colons among them. This can be used in a rule like this:
'^[^:]*:SNMP:': alert log;
The wildcard can be used more than once in a singe rule, for instance if we want to catch event number 6009 from the SNMP source. SysOrb places the event number as the fourth field in the colon delimited string, so we do not care about the first and third field, only the secon and fourth. This can be achived with the following pattern:
'^[^:]*:SNMP:[^:]*:6009:': alert log;
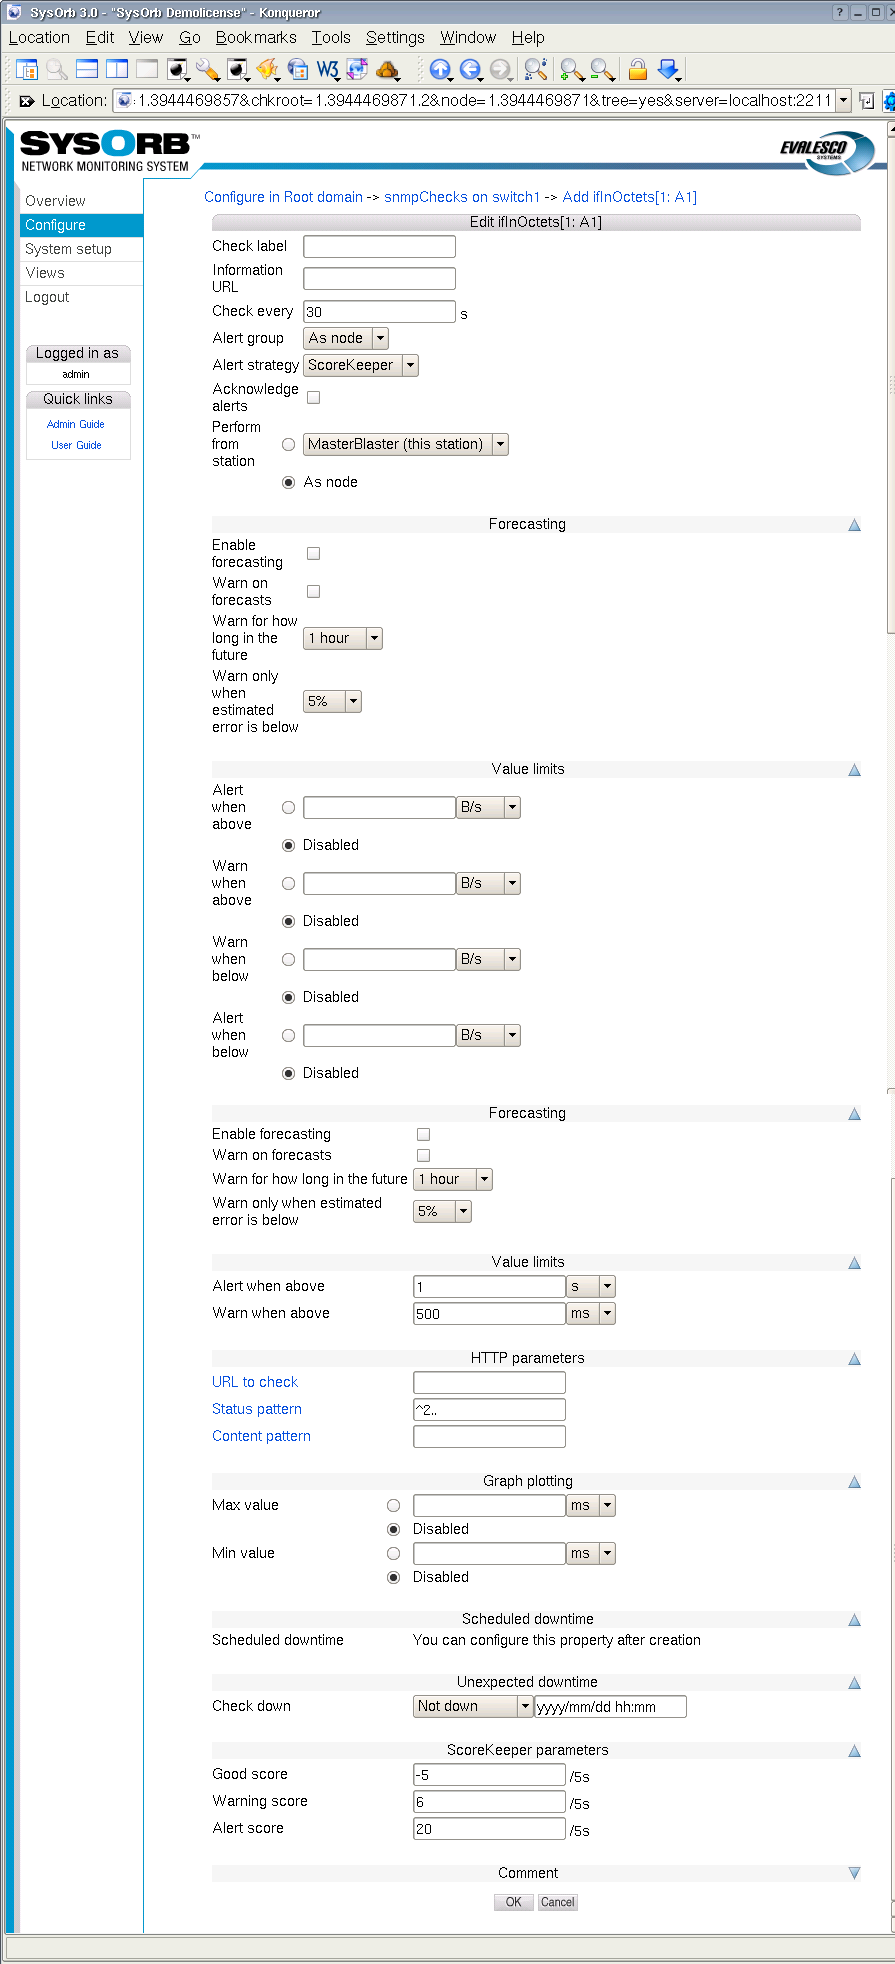
4.4.3. snmpChecks
If a node supports the SNMP protocol it is possible to monitor the node using that. SNMP can provide much more information than NetChecks, but does not require installation of extra software like AgentChecks. This is useful for monitoring SNMP aware printers/switches/routers/firewalls, but can also be used to monitor a ordinary computers.
To enable an snmpCheck on a node, do the following:
-
Select from the navigation buttons at the left.
-
Select the domain containing the node you wish to enable snmpChecks on.
-
Select the option for the node you wish to edit.
-
Select the option.
-
Select the button.
-
If you see no checks in the list, you need to scan the SNMP capabilities of the node. Click the button at the bottom of the page to start the scan. The scanning usually takes a few minutes, watch the Incident log to be sure. A log messages will be inserted when the scanning starts and when it completes.
-
Browse the tree to find the item to monitor and select . If there are no checks in the tree, then go back to the , and select for the node. In there write the correct Community and Password and press the button.
-
Configure the check.
-
Press the button to accept the changes or the button to discard the changes.
snmpChecks are like AgentChecks grouped into continuous and enumeration. The configuration parameters are equal to those of the AgentChecks, please refer to Section 4.4.2 for a thorough description.
4.4.4. ESXi checks
SysOrb provides you with a "single pane of glass" monitoring of your VMware infrastructure.
SysOrb supports monitoring of health and performance status of VMware ESXi hosts via an easy to use web interface. SysOrb enables the users to define threshold values in order for SysOrb to trigger alert notifications upon violation of those thresholds. SysOrb uses vSphere Hypervisor APIs to collect the critical metrics for the host as well as the VMs.
This is useful in situations where a server with several virtual machines needs to be monitored. . It is important to understand that all checks for the server and its Virtual Machines will be located on the same node, this means that it is still recommended to install agents on virtual machines if a detailed and complete picture of the individual VM's is needed.
-
Monitor the health and performance of the physical hardware where the host runs.
-
Monitor basic health and performance (cpu, memory, ...) of each virtual instance in the virtual environment.
-
Troubleshoot problems in the virtual environment before they happen
-
Easy setup and configure thresholds for alarms and have sent via email, SMS or script
-
All data is instantly viewable in high resolution graphs giving you a unique overview of your virtual environment.
4.4.4.1. SysOrb agents for deep monitoring of the OS and applications running on the virtual machine
If you need deep monitoring of the OS and applications running on each single virtual instance you simply install the SysOrb agent. The SysOrb agent is very light weight software which support windows, Linux, and Novell platform.
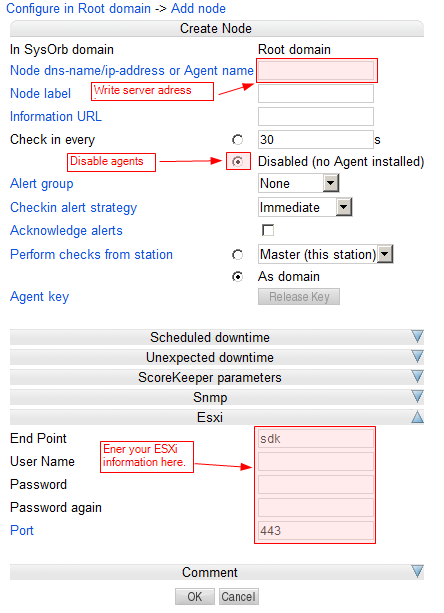
To set up a node with ESXi first this is to create a new node that should contain the checks. You should have set up VMware to allow monitoring.
-
Make sure you navigate the to domain where you want your node to appear
-
Click on configure in the left pane
-
Click on "add node" to add a new node.
-
Configure the node by writing the address to the server, removing the agent check, and adding the ESXi settings.
4.4.5. Cumulative checks
Some SysOrb checks measures events per second or bytes per second, when what you really want to know is the total number of events/bytes in one day, week or month. If this is the case, you can use cumulative checks.
If you want to monitor the monthly traffic on a switch or router port for instance, you should first configure ordinary checks on ifInOctets and ifOutOctets on the port in question. You do not have to configure any alert limits on the check itself.
You should then see an option called to the right of the newly enabled check. Click that link, and you will be presented with a configuration dialog with options for the accumulation, that you are about to create.
-
Accumulation period: This allows you to selec the period for which to accumulate data from the check. Possible values are: 1 day, 1 week, 1 month, 3 months, 6 months, 1 year.
Default value: 1 month
-
Rolling accumulation: SysOrb support two types of accumulations: rolling or calendar. A monthly rolling accumulation will sum the traffic for the last 30 days, e.g. from 3 pm April 15th to 3 pm May 15th. A monthly calendar accumulation will sum the traffic from the start of the current month to now, e.g. from midnight May 1st to 3 pm May 15th.
Default value: Disabled (calendar accumulation)
-
One shot alert: This field applies only to calendar accumulations. When you have configured upper limits to the accumulated traffic, and that limit has been reached halfway through the accumulation period, then you may not want to continually receive alerts because of the accumulation, which cannot possible drop below the limit before the start of next accumulation period (when the sum is reset.)
Note: Emails and SMS'es are inherently unreliable. If you enable one shot alerts, and the email get lost, you will never receive notifacation about the condition. Alternatively you can refrain from enabling one shot alerts, and instead make use of unexpected downtime whenever you receive alerts from the accumulation.
Default value: Disabled
The rest of the options works as for ordinary checks. Only that Warn when below and Alert when below does not make sense for calendar accumulations, as they would always trigger when the sum is reset at the beginning of every month (or whatever period is selected.)